## Diagram: System Architecture with Broadcast and Selection
### Overview
The image displays a technical system architecture diagram illustrating a data flow or communication process. The diagram consists of labeled components connected by directional arrows, indicating the flow of information or signals. The primary languages present are English, as all labels are in English.
### Components/Axes
The diagram is composed of the following labeled components and connecting lines:
1. **Components (Nodes):**
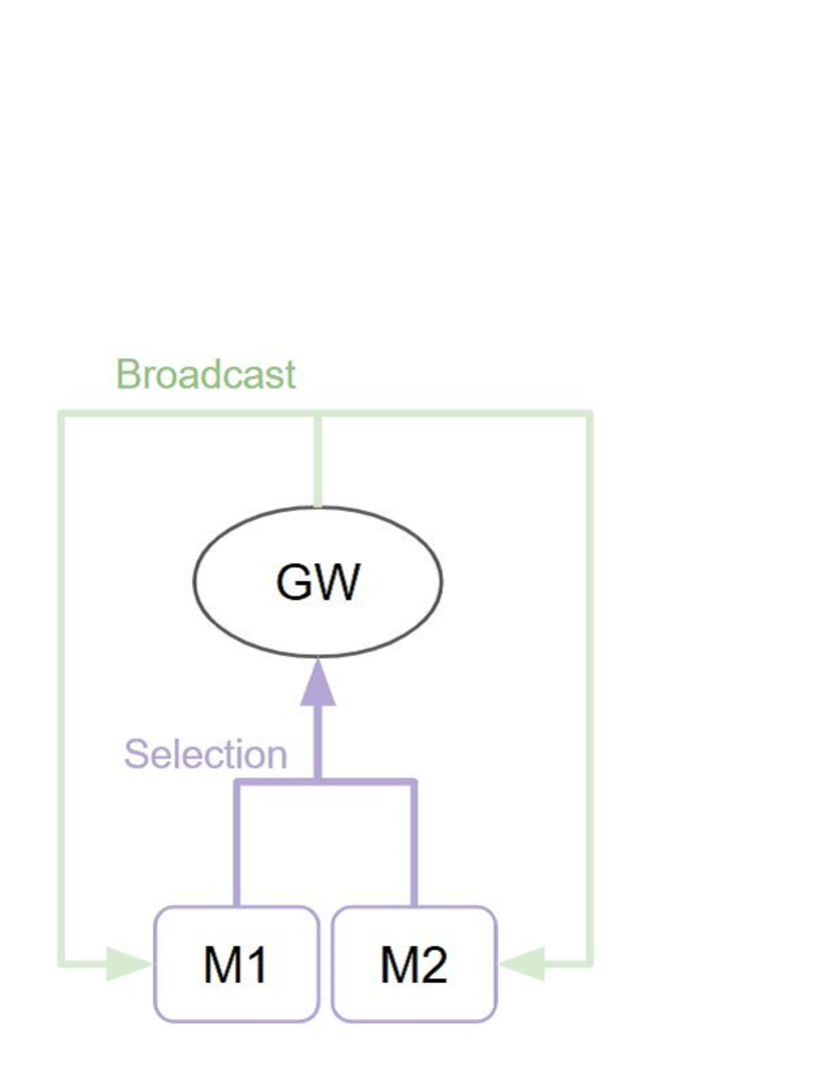
* **GW**: An oval-shaped node located in the upper-center of the diagram. The label "GW" is written in black text inside the oval.
* **M1**: A rectangular node located at the bottom-left. The label "M1" is written in black text inside the rectangle.
* **M2**: A rectangular node located at the bottom-right. The label "M2" is written in black text inside the rectangle.
2. **Labels and Connectors:**
* **Broadcast**: A label in green text positioned at the top-center of the diagram, above the main structure.
* **Selection**: A label in purple text positioned to the left of the central vertical connector, between the GW and the M1/M2 nodes.
* **Green Lines (Broadcast Path):** A green line originates from the "Broadcast" label, forms a rectangular frame around the diagram, and terminates with inward-pointing arrows at both the **M1** and **M2** nodes. This indicates a broadcast signal or data stream being sent simultaneously to both M1 and M2.
* **Purple Lines (Selection Path):** A purple line originates from the top of both the **M1** and **M2** nodes, merges into a single vertical line, and terminates with an upward-pointing arrow at the bottom of the **GW** node. This indicates that outputs or selections from M1 and M2 are combined and sent to the GW.
### Detailed Analysis
* **Flow Direction:** The diagram depicts a clear, two-stage flow:
1. **Stage 1 (Broadcast):** A signal or data originates from the "Broadcast" source and is distributed to both modules, M1 and M2.
2. **Stage 2 (Selection):** Modules M1 and M2 process the broadcast input. Their outputs are then selected or aggregated (as indicated by the "Selection" label) and forwarded to the central "GW" component.
* **Spatial Relationships:** The "GW" node is centrally positioned as the final destination. The "M1" and "M2" nodes are placed symmetrically at the bottom, acting as parallel processing units. The "Broadcast" label and its associated green frame encompass the entire system, emphasizing its role as the initial, wide-reaching input.
### Key Observations
* The diagram uses color coding to distinguish between different data paths: **green** for the broadcast distribution and **purple** for the selective aggregation.
* The structure is symmetrical with respect to M1 and M2, suggesting they may have identical or similar functions within the system.
* The "GW" (likely an abbreviation for "Gateway") is the singular convergence point, indicating it is a central controller, aggregator, or decision-making unit.
### Interpretation
This diagram illustrates a common pattern in distributed systems, sensor networks, or communication protocols. The "Broadcast" represents a one-to-many communication (e.g., a command, a sensor ping, or a data packet sent to all nodes). The modules "M1" and "M2" act as receivers and processors. The "Selection" process implies that not all data from M1 and M2 is forwarded; instead, a specific subset, a result, or a chosen signal is sent to the "GW". This could represent:
* A **data fusion** system where multiple sensors (M1, M2) report to a central processor (GW).
* A **redundancy or voting system** where the GW selects the most reliable input from M1 and M2.
* A **resource allocation** scenario where the GW makes a decision based on inputs from two competing modules.
The absence of numerical data means the diagram's purpose is to convey **structural and relational information** rather than quantitative results. It defines the architecture and data flow logic of the system.