## Scatter Plot: Management Confidence vs. Target Length
### Overview
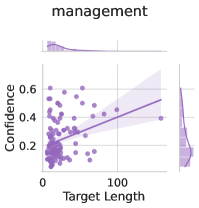
The image is a scatter plot showing the relationship between "Confidence" and "Target Length" for the category "management". The plot includes a regression line with a confidence interval, as well as marginal distributions for each variable.
### Components/Axes
* **Title:** management
* **X-axis:** Target Length
* Scale: 0 to 100
* **Y-axis:** Confidence
* Scale: 0 to 0.6
* **Data Points:** Each point represents a data entry, colored in a light purple.
* **Regression Line:** A light purple line shows the linear relationship between Target Length and Confidence.
* **Confidence Interval:** A shaded light purple area around the regression line indicates the confidence interval.
* **Marginal Distributions:** Histograms are present on the top and right sides of the scatter plot, showing the distribution of Target Length and Confidence, respectively.
### Detailed Analysis
* **Target Length:**
* Ranges from approximately 0 to 100.
* The marginal distribution (histogram at the top) shows a high concentration of data points at lower values of Target Length.
* **Confidence:**
* Ranges from approximately 0 to 0.6.
* The marginal distribution (histogram on the right) shows a concentration of data points at lower values of Confidence.
* **Data Points:**
* The majority of data points are clustered at the lower-left corner of the plot, indicating low Target Length and low Confidence.
* There are some data points scattered throughout the plot, indicating a range of Target Length and Confidence values.
* **Regression Line:**
* The regression line slopes upward, indicating a positive correlation between Target Length and Confidence.
* The slope appears to be relatively shallow, suggesting a weak positive correlation.
* **Confidence Interval:**
* The confidence interval widens as Target Length increases, indicating greater uncertainty in the predicted Confidence values at higher Target Lengths.
### Key Observations
* There is a weak positive correlation between Target Length and Confidence.
* Most data points have low Target Length and low Confidence.
* The uncertainty in the predicted Confidence values increases with Target Length.
### Interpretation
The scatter plot suggests that, for the "management" category, there is a slight tendency for Confidence to increase as Target Length increases. However, the correlation is weak, and the majority of data points are clustered at low values of both variables. The widening confidence interval at higher Target Lengths indicates that the relationship between Target Length and Confidence is less certain for longer targets. This could mean that other factors play a more significant role in determining Confidence for longer targets.