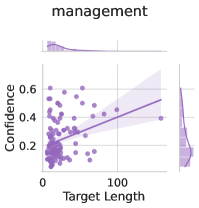
## Scatter Plot with Regression: Management Confidence vs. Target Length
### Overview
The image is a statistical visualization, specifically a scatter plot with an overlaid linear regression line and marginal density plots. It examines the relationship between "Target Length" (x-axis) and "Confidence" (y-axis) under the title "management." The plot suggests a positive correlation between the two variables.
### Components/Axes
* **Title:** "management" (centered at the top).
* **X-Axis:**
* **Label:** "Target Length"
* **Scale:** Linear. Visible tick marks at `0` and `100`. The data range appears to extend from approximately 0 to 150.
* **Y-Axis:**
* **Label:** "Confidence"
* **Scale:** Linear. Visible tick marks at `0`, `0.2`, `0.4`, and `0.6`.
* **Data Series:**
* **Scatter Points:** Numerous purple circular markers representing individual data points.
* **Regression Line:** A solid, darker purple line showing the best-fit linear trend.
* **Confidence Interval:** A semi-transparent purple shaded region surrounding the regression line, indicating the uncertainty of the fit.
* **Marginal Distributions:**
* **Top (X-axis distribution):** A density plot (filled area) showing the distribution of the "Target Length" variable. It is heavily right-skewed, with a high peak near 0 and a long tail extending to the right.
* **Right (Y-axis distribution):** A density plot showing the distribution of the "Confidence" variable. It appears roughly unimodal, with a peak between 0.2 and 0.3, and a tail extending towards higher values.
### Detailed Analysis
* **Data Point Distribution:** The majority of data points are densely clustered in the lower-left quadrant of the plot, corresponding to **Target Length values between 0 and ~50** and **Confidence values between 0 and ~0.4**. There is a high density of points near the origin (0,0).
* **Trend Verification:** The regression line has a clear **positive slope**, rising from left to right. This indicates that as "Target Length" increases, "Confidence" tends to increase as well.
* **Regression Line & Uncertainty:** The line originates at a Confidence value slightly above 0 when Target Length is 0. It passes through approximately (100, 0.35). The shaded confidence interval is narrow near the center of the data mass (low Target Length) and **widens significantly as Target Length increases**, indicating greater uncertainty in the trend prediction for higher Target Length values where data is sparse.
* **Outliers:** Several data points exist as outliers with **Target Length > 100** and **Confidence > 0.4**, with one point reaching near the maximum Confidence of ~0.6. These points pull the regression line upward.
* **Marginal Plot Details:**
* The **top density plot** confirms the visual clustering: the highest density of "Target Length" values is near 0, with frequency dropping off sharply as length increases.
* The **right density plot** shows the most common "Confidence" values are centered around 0.25, with a secondary, smaller concentration near 0.5.
### Key Observations
1. **Positive Correlation:** There is a visible, positive linear relationship between Target Length and Confidence.
2. **Heteroscedasticity:** The spread of Confidence values appears to increase with Target Length (the "fan shape"), which is also reflected in the widening confidence interval of the regression line.
3. **Data Sparsity:** The relationship is primarily defined by a dense cluster of points at low Target Length. The trend for higher Target Lengths is inferred from a much smaller number of data points.
4. **Non-Normal Distributions:** Both variables show skewed distributions, as evidenced by the marginal density plots.
### Interpretation
The chart suggests that in the context of "management," longer targets are associated with higher confidence levels. However, this interpretation requires caution due to the data structure.
* **Causality vs. Correlation:** The plot shows correlation, not causation. It's unclear if longer targets *cause* higher confidence, if higher confidence leads to setting longer targets, or if a third factor influences both.
* **Reliability of Trend:** The positive trend is most reliable for Target Lengths under 50, where data is abundant. The extrapolation to longer targets (100+) is based on sparse data and carries high uncertainty, as shown by the wide confidence interval.
* **Underlying Pattern:** The dense cluster near the origin suggests that most management scenarios involve relatively short targets and low-to-moderate confidence. The outliers with high length and high confidence may represent special cases, ambitious projects, or potentially different underlying conditions.
* **Investigative Insight:** A key question arising from this visualization is: *What characterizes the outlier cases with both high target length and high confidence?* Analyzing these specific instances could reveal factors that successfully couple ambitious goals with assuredness. The heteroscedasticity (increasing variance) also suggests that as targets become longer, other unmeasured factors play a larger role in determining confidence.