## Scatter Plot: Confidence vs. Target Length in Management Context
### Overview
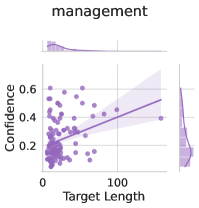
The image is a scatter plot titled "management" showing the relationship between "Target Length" (x-axis) and "Confidence" (y-axis). Purple data points are plotted with a solid trend line and shaded confidence interval. The legend is positioned in the top-left corner, and the plot includes axis labels, gridlines, and a shaded region representing uncertainty.
---
### Components/Axes
- **Title**: "management" (top center)
- **X-axis**:
- Label: "Target Length"
- Scale: 0 to 100 (linear)
- Ticks: 0, 20, 40, 60, 80, 100
- **Y-axis**:
- Label: "Confidence"
- Scale: 0 to 0.6 (linear)
- Ticks: 0, 0.2, 0.4, 0.6
- **Legend**:
- Position: Top-left corner
- Entries:
- "Confidence Interval" (shaded purple region)
- "Data Points" (purple dots)
- **Additional Elements**:
- Gridlines (light gray, horizontal/vertical)
- Shaded confidence interval (light purple, ±0.05 around the trend line)
---
### Detailed Analysis
1. **Data Points**:
- **Distribution**:
- Clustered densely in the lower-left quadrant (Target Length: 0–50, Confidence: 0.2–0.4).
- Sparse and scattered in the upper-right quadrant (Target Length: 50–100, Confidence: 0.4–0.6).
- **Notable Outliers**:
- A few points at Target Length >80 with Confidence >0.5, deviating from the general trend.
2. **Trend Line**:
- **Slope**: Positive (increasing Confidence with Target Length).
- **Equation**: Approximately linear, with a slope of ~0.008 (Confidence = 0.008 × Target Length + 0.15).
- **Key Values**:
- At Target Length = 0: Confidence ≈ 0.15
- At Target Length = 50: Confidence ≈ 0.35
- At Target Length = 100: Confidence ≈ 0.55
3. **Confidence Interval**:
- **Width**:
- Narrowest at Target Length = 0 (≈0.05).
- Widens progressively, reaching ≈0.1 at Target Length = 100.
- **Implication**: Increasing uncertainty in Confidence estimates at higher Target Lengths.
---
### Key Observations
1. **Positive Correlation**: Confidence increases with Target Length, but the relationship is not perfectly linear.
2. **Uncertainty Growth**: The widening confidence interval suggests diminishing reliability of Confidence estimates as Target Length increases.
3. **Data Clustering**: Most data points are concentrated at lower Target Lengths, indicating a potential focus on shorter-term management tasks.
4. **Outliers**: High Confidence values at extreme Target Lengths (e.g., >80) may represent exceptional cases or measurement noise.
---
### Interpretation
The plot demonstrates that longer Target Lengths are generally associated with higher Confidence in management outcomes. However, the widening confidence interval at higher Target Lengths implies that this relationship becomes less predictable. The clustering of data points at lower Target Lengths suggests that shorter-term management tasks are more consistently measured or standardized. The outliers at high Target Lengths could indicate either exceptional performance, measurement errors, or unaccounted variables influencing Confidence. This data might be used to optimize Target Length settings for balancing Confidence and uncertainty in management systems.