## Horizontal Bar Chart: Comparison of NTN and RMNN Performance
### Overview
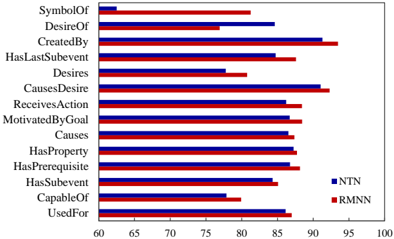
The image is a horizontal bar chart comparing the performance of two models, NTN (blue bars) and RMNN (red bars), across various relation types. The x-axis represents performance, ranging from 60 to 100. The y-axis lists different relation types.
### Components/Axes
* **X-axis:** Performance (ranging from 60 to 100)
* **Y-axis:** Relation Types (SymbolOf, DesireOf, CreatedBy, HasLastSubevent, Desires, CausesDesire, ReceivesAction, MotivatedByGoal, Causes, HasProperty, HasPrerequisite, HasSubevent, CapableOf, UsedFor)
* **Legend:** Located in the bottom-right corner.
* Blue square: NTN
* Red square: RMNN
### Detailed Analysis
Here's a breakdown of the performance of each model for each relation type:
* **SymbolOf:** NTN ~62, RMNN ~82
* **DesireOf:** NTN ~87, RMNN ~88
* **CreatedBy:** NTN ~92, RMNN ~93
* **HasLastSubevent:** NTN ~87, RMNN ~90
* **Desires:** NTN ~78, RMNN ~80
* **CausesDesire:** NTN ~85, RMNN ~86
* **ReceivesAction:** NTN ~87, RMNN ~88
* **MotivatedByGoal:** NTN ~87, RMNN ~88
* **Causes:** NTN ~87, RMNN ~88
* **HasProperty:** NTN ~86, RMNN ~87
* **HasPrerequisite:** NTN ~85, RMNN ~87
* **HasSubevent:** NTN ~83, RMNN ~84
* **CapableOf:** NTN ~78, RMNN ~80
* **UsedFor:** NTN ~85, RMNN ~86
### Key Observations
* RMNN consistently performs slightly better than NTN across most relation types.
* The largest performance difference is observed in "SymbolOf," where RMNN significantly outperforms NTN.
* The performance difference between the two models is minimal for relation types like "DesireOf", "ReceivesAction", "MotivatedByGoal", and "Causes".
* Both models generally achieve higher performance on relation types like "CreatedBy" and "HasLastSubevent" compared to "SymbolOf" and "Desires".
### Interpretation
The data suggests that RMNN is generally a more effective model than NTN for the tested relation types. The significant difference in performance for "SymbolOf" indicates that RMNN may be better at handling symbolic relationships. The relatively consistent performance across other relation types suggests that both models have similar strengths and weaknesses in those areas. The high performance on "CreatedBy" and "HasLastSubevent" could indicate that both models are particularly well-suited for handling relationships involving creation and event sequencing.