\n
## Bar Chart: Relation Classification Performance Comparison
### Overview
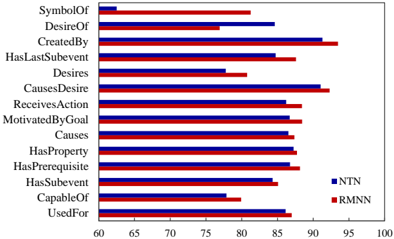
This image presents a bar chart comparing the performance of two models, NTN (Neural Tensor Networks) and RMN (Relational Memory Networks), on a relation classification task. The chart displays the performance scores for various relation types. The x-axis represents the performance score, ranging from 60 to 100, and the y-axis lists the different relation types.
### Components/Axes
* **X-axis Title:** (Implicitly) Performance Score (%)
* **X-axis Scale:** 60, 65, 70, 75, 80, 85, 90, 95, 100
* **Y-axis Title:** Relation Type
* **Y-axis Categories:**
* SymbolOf
* DesireOf
* CreatedBy
* HasLastSubevent
* Desires
* CausesDesire
* ReceivesAction
* MotivatedByGoal
* Causes
* HasProperty
* HasPrerequisite
* HasSubevent
* CapableOf
* UsedFor
* **Legend:**
* NTN (Blue)
* RMN (Red)
* **Legend Position:** Top-right corner
### Detailed Analysis
The chart consists of horizontal bars for each relation type, with two bars per type representing the performance of NTN and RMN.
Here's a breakdown of the approximate performance scores for each relation type:
* **SymbolOf:** NTN ≈ 72%, RMN ≈ 78%
* **DesireOf:** NTN ≈ 78%, RMN ≈ 82%
* **CreatedBy:** NTN ≈ 88%, RMN ≈ 94%
* **HasLastSubevent:** NTN ≈ 83%, RMN ≈ 86%
* **Desires:** NTN ≈ 72%, RMN ≈ 74%
* **CausesDesire:** NTN ≈ 85%, RMN ≈ 91%
* **ReceivesAction:** NTN ≈ 82%, RMN ≈ 88%
* **MotivatedByGoal:** NTN ≈ 81%, RMN ≈ 85%
* **Causes:** NTN ≈ 82%, RMN ≈ 86%
* **HasProperty:** NTN ≈ 82%, RMN ≈ 86%
* **HasPrerequisite:** NTN ≈ 83%, RMN ≈ 87%
* **HasSubevent:** NTN ≈ 82%, RMN ≈ 86%
* **CapableOf:** NTN ≈ 78%, RMN ≈ 82%
* **UsedFor:** NTN ≈ 84%, RMN ≈ 90%
**Trends:**
* Generally, RMN outperforms NTN across most relation types.
* The performance difference between the two models varies depending on the relation type.
* The performance scores are relatively clustered between 70% and 95%.
### Key Observations
* RMN consistently achieves higher scores than NTN.
* The largest performance gap is observed for the "CreatedBy" relation, where RMN significantly outperforms NTN.
* The smallest performance gap is observed for the "Desires" relation.
* All relation types have performance scores above 70% for both models.
### Interpretation
The data suggests that RMN is a more effective model than NTN for relation classification across a variety of relation types. The consistent outperformance of RMN indicates that its architecture or training methodology is better suited for capturing the nuances of relational information. The significant difference in performance for "CreatedBy" suggests that this relation type is particularly challenging for NTN, and RMN is better equipped to handle its complexities. The relatively high performance scores for all relation types indicate that both models are reasonably effective, but RMN offers a substantial improvement in accuracy. This comparison is valuable for researchers and practitioners interested in developing and deploying relation classification systems. The chart provides a clear visual representation of the strengths and weaknesses of each model, allowing for informed decision-making.