## Radar Chart: Scaling ability
### Overview
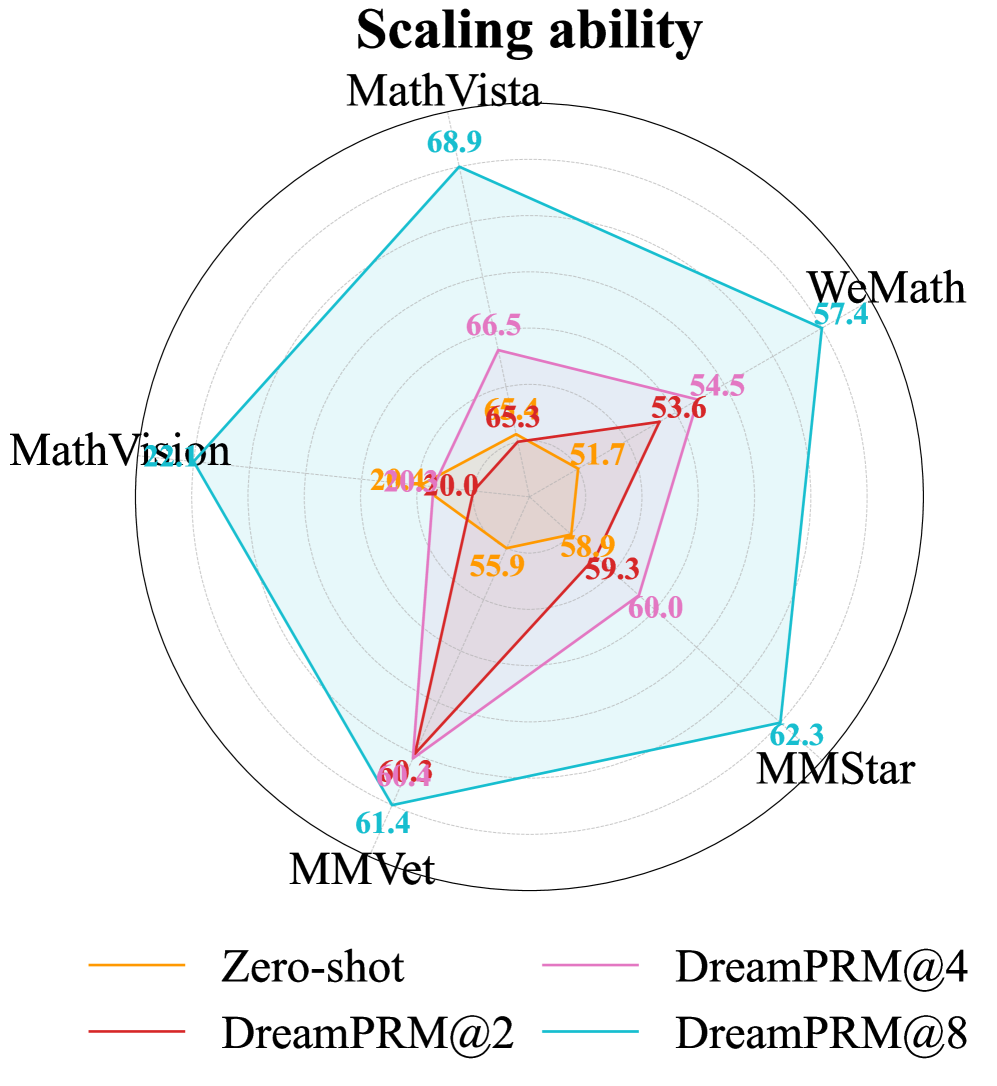
The image is a radar chart displaying the scaling ability of different models (Zero-shot, DreamPRM@2, DreamPRM@4, and DreamPRM@8) across five categories: MathVista, WeMath, MMStar, MMVet, and MathVision. The chart visualizes the performance of each model in each category, with higher values indicating better scaling ability.
### Components/Axes
* **Title:** Scaling ability
* **Categories (Axes):** MathVista, WeMath, MMStar, MMVet, MathVision. These are arranged in a circular fashion.
* **Data Series:**
* Zero-shot (Orange line)
* DreamPRM@2 (Red line)
* DreamPRM@4 (Pink line)
* DreamPRM@8 (Cyan line)
* **Scale:** The chart has concentric circular gridlines, but no explicit numerical scale is provided. Values are labeled directly next to each data point.
* **Legend:** Located at the bottom of the chart, associating colors with model names.
### Detailed Analysis
* **MathVista:**
* DreamPRM@8: 68.9
* **WeMath:**
* DreamPRM@8: 57.4
* DreamPRM@4: 53.6
* **MMStar:**
* DreamPRM@8: 62.3
* DreamPRM@4: 60.0
* **MMVet:**
* DreamPRM@8: 61.4
* DreamPRM@2: 60.4
* **MathVision:**
* DreamPRM@8: 66.5
* DreamPRM@4: 55.9
* DreamPRM@2: 58.9
* Zero-shot: 65.3
**Trend Verification and Data Points:**
* **Zero-shot (Orange):** The Zero-shot model shows relatively consistent performance across MathVision (65.3).
* **DreamPRM@2 (Red):** The DreamPRM@2 model shows relatively consistent performance across MathVision (58.9), MMVet (60.4), WeMath (54.5).
* **DreamPRM@4 (Pink):** The DreamPRM@4 model shows relatively consistent performance across MathVision (55.9), MMStar (60.0), WeMath (53.6).
* **DreamPRM@8 (Cyan):** The DreamPRM@8 model generally outperforms the other models across all categories. The values are MathVista (68.9), WeMath (57.4), MMStar (62.3), MMVet (61.4), and MathVision (66.5).
### Key Observations
* DreamPRM@8 consistently achieves the highest scaling ability across all categories.
* Zero-shot has the highest scaling ability in MathVision.
* The performance of DreamPRM@2 and DreamPRM@4 is generally lower than DreamPRM@8.
### Interpretation
The radar chart effectively visualizes the scaling ability of different models across various categories. The DreamPRM@8 model demonstrates superior scaling ability compared to the other models, suggesting that increasing the parameter size or complexity of the DreamPRM model leads to improved performance. The Zero-shot model shows competitive performance in MathVision, indicating its potential in specific areas. The chart highlights the strengths and weaknesses of each model, providing valuable insights for model selection and optimization.