## Radar Chart: Scaling Ability Across Five Benchmarks
### Overview
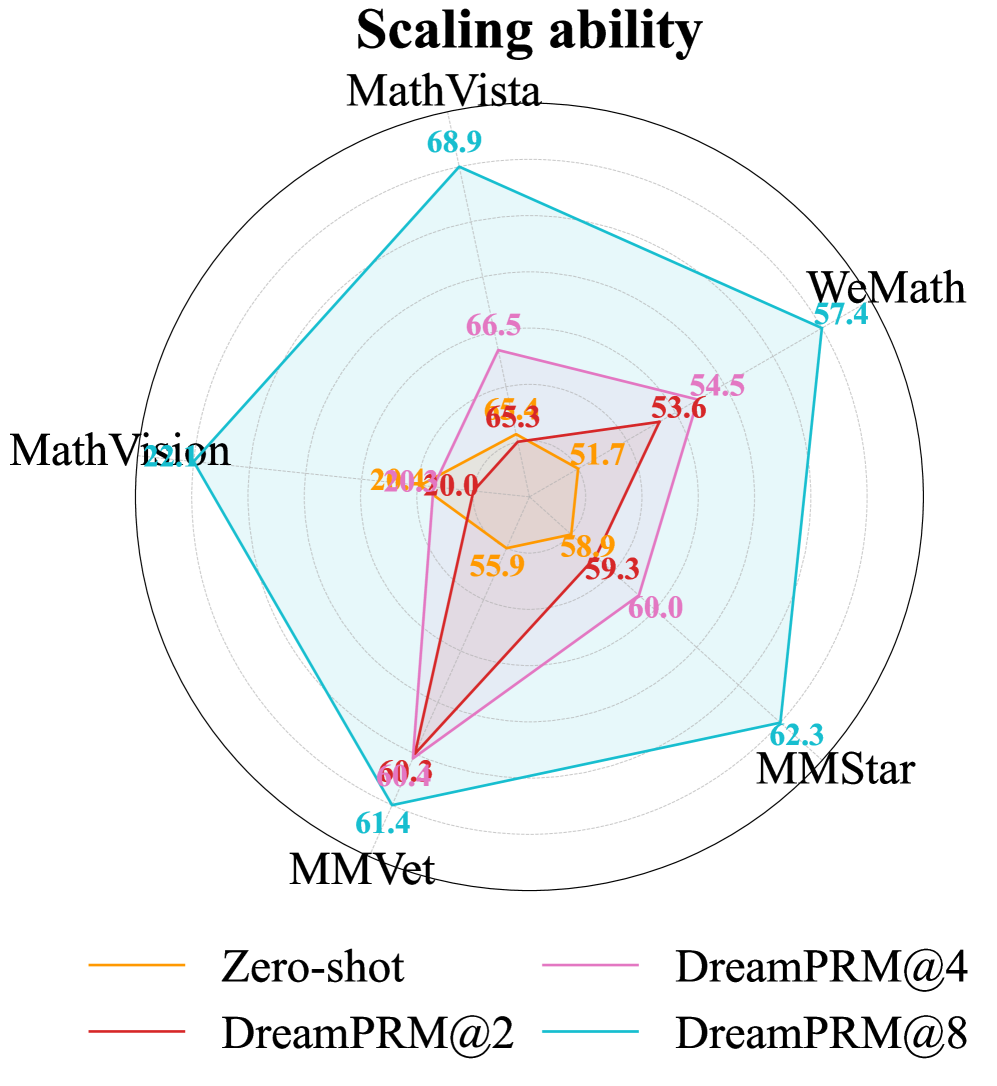
This image is a radar chart (also known as a spider chart) titled "Scaling ability". It visually compares the performance of four different methods or models across five distinct benchmarks. The chart uses concentric polygons to represent the score of each method on each benchmark, allowing for a quick comparison of their overall capabilities and relative strengths.
### Components/Axes
* **Chart Title:** "Scaling ability" (centered at the top).
* **Axes (Benchmarks):** The chart has five axes radiating from the center, each representing a benchmark. The labels are placed at the outer end of each axis:
* **Top (12 o'clock):** MathVista
* **Top-Right (2-3 o'clock):** WeMath
* **Bottom-Right (4-5 o'clock):** MMStar
* **Bottom-Left (7-8 o'clock):** MMVet
* **Left (9 o'clock):** MathVision
* **Legend:** Positioned at the bottom of the chart, centered horizontally. It contains four entries, each with a colored line segment and a label:
* **Orange Line:** Zero-shot
* **Red Line:** DreamPRM@2
* **Pink Line:** DreamPRM@4
* **Cyan (Light Blue) Line:** DreamPRM@8
* **Scale:** The chart uses concentric polygons (approximating circles) to indicate score levels. The outermost ring represents the highest possible score (implied to be 100 or a normalized maximum), with scores decreasing toward the center. Specific numerical score labels are placed directly on the chart near the vertices of each polygon.
### Detailed Analysis
The chart plots the score of each method on each benchmark. The visual trend for each series is as follows:
* **DreamPRM@8 (Cyan):** Forms the outermost polygon, indicating the highest overall performance. Its shape is relatively balanced but peaks at MathVista.
* **DreamPRM@4 (Pink):** Forms a polygon inside the cyan one, showing lower performance than @8 but generally higher than the others.
* **DreamPRM@2 (Red):** Forms a polygon inside the pink one, with a notably sharp, narrow shape, indicating more variable performance across benchmarks.
* **Zero-shot (Orange):** Forms the innermost polygon, representing the baseline performance.
**Data Points by Benchmark (Approximate Values):**
1. **MathVista (Top Axis):**
* DreamPRM@8 (Cyan): 68.9
* DreamPRM@4 (Pink): 66.5
* DreamPRM@2 (Red): 65.3
* Zero-shot (Orange): 65.3 (Note: The red and orange labels overlap here, suggesting very close or identical scores.)
2. **WeMath (Top-Right Axis):**
* DreamPRM@8 (Cyan): 57.4
* DreamPRM@4 (Pink): 54.5
* DreamPRM@2 (Red): 53.6
* Zero-shot (Orange): 51.7
3. **MMStar (Bottom-Right Axis):**
* DreamPRM@8 (Cyan): 62.3
* DreamPRM@4 (Pink): 60.0
* DreamPRM@2 (Red): 59.3
* Zero-shot (Orange): 58.9
4. **MMVet (Bottom-Left Axis):**
* DreamPRM@8 (Cyan): 61.4
* DreamPRM@4 (Pink): 60.3
* DreamPRM@2 (Red): 60.3 (The red and pink labels are very close, indicating near-identical scores.)
* Zero-shot (Orange): 55.9
5. **MathVision (Left Axis):**
* DreamPRM@8 (Cyan): 60.0 (The label is placed near the axis but slightly offset; the vertex is on the axis line.)
* DreamPRM@4 (Pink): 20.0 (This appears to be a significant outlier, with the pink vertex pulled sharply inward.)
* DreamPRM@2 (Red): 20.0 (Similar outlier, with the red vertex also pulled inward to the same point.)
* Zero-shot (Orange): 20.0 (All three inner series converge at this low point on the MathVision axis.)
### Key Observations
1. **Clear Performance Hierarchy:** There is a consistent ranking across all benchmarks: DreamPRM@8 > DreamPRM@4 > DreamPRM@2 ≈ Zero-shot. The cyan polygon fully encloses the pink, which encloses the red/orange cluster.
2. **Scaling Effect:** The "@8", "@4", and "@2" notation likely refers to a scaling parameter (e.g., number of reasoning steps, ensemble size). Performance improves monotonically with this parameter, as seen by the expanding polygons from Zero-shot to DreamPRM@8.
3. **MathVision Anomaly:** All methods except DreamPRM@8 show a dramatic drop in performance on the MathVision benchmark, scoring only ~20. This creates a sharp inward "pinch" in the red, pink, and orange polygons on the left side of the chart. DreamPRM@8 maintains a high score (~60) here, suggesting it uniquely overcomes a challenge present in this benchmark for the other methods.
4. **Converging Scores:** On the MMVet axis, the scores for DreamPRM@4 and DreamPRM@2 are nearly identical (60.3 vs. 60.3). On the MathVision axis, the scores for Zero-shot, DreamPRM@2, and DreamPRM@4 are identical (20.0).
5. **Most Improved Benchmark:** The largest absolute gain from the baseline (Zero-shot) to the top method (DreamPRM@8) appears on the MathVision benchmark (+40 points), followed by MathVista (+3.6 points) and WeMath (+5.7 points).
### Interpretation
This radar chart effectively demonstrates the "scaling ability" of the DreamPRM method. The core finding is that increasing the scaling parameter (from @2 to @4 to @8) leads to consistent and significant performance improvements across a diverse set of visual-mathematical reasoning benchmarks.
The data suggests that the DreamPRM@8 model is not only the strongest overall but also the most robust. Its ability to maintain high performance on MathVision, where all other methods fail catastrophically, indicates it has developed a more generalizable or powerful reasoning capability that the others lack. The near-identical, low scores of the other methods on MathVision point to a specific, shared limitation in their approach that scaling to @8 overcomes.
The chart tells a story of progressive capability enhancement. The Zero-shot and DreamPRM@2 models are tightly clustered, showing limited benefit from minimal scaling. DreamPRM@4 shows a clear step up, and DreamPRM@8 represents a substantial leap, particularly in conquering the most difficult benchmark (MathVision). This visual evidence strongly supports the conclusion that the scaling mechanism employed in DreamPRM is highly effective for improving multimodal mathematical reasoning.