## Radar Chart: Scaling ability
### Overview
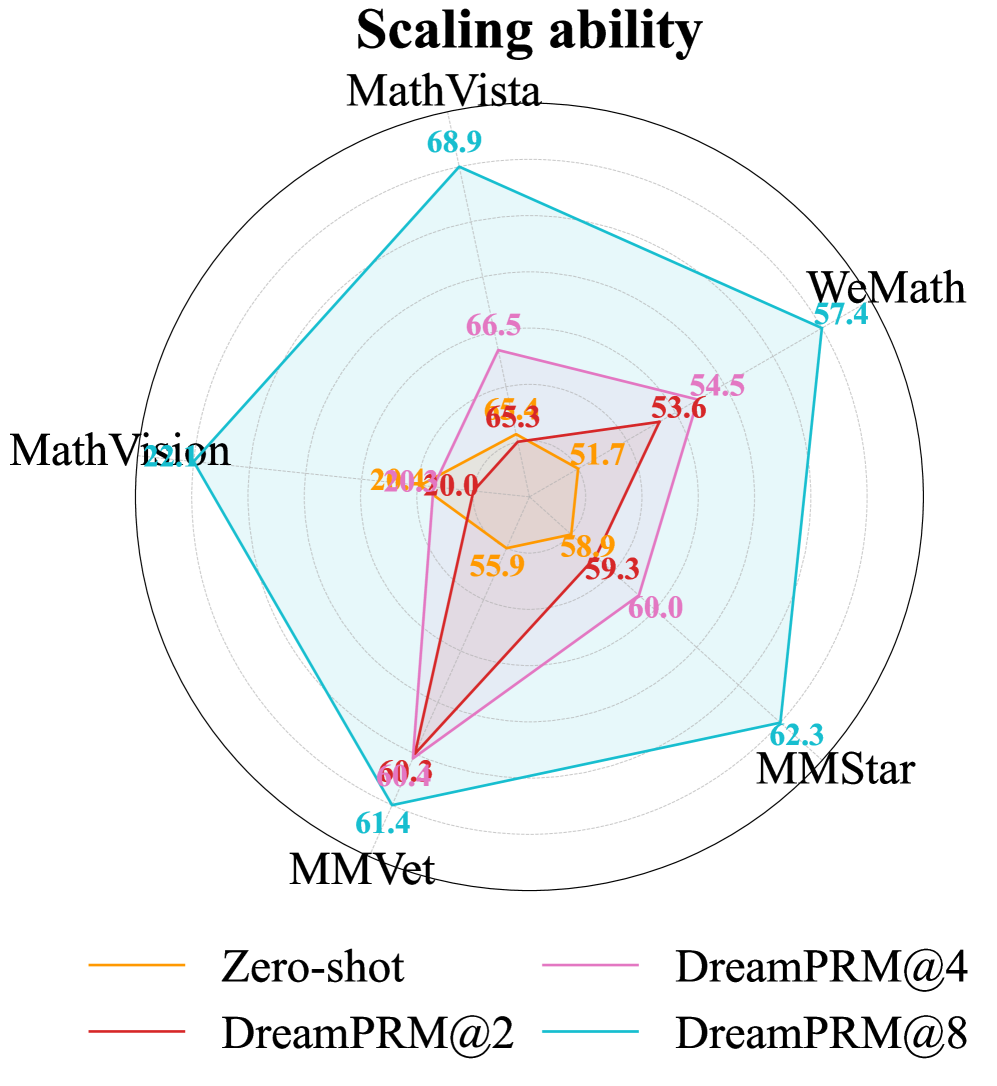
The chart compares the performance of four model configurations (Zero-shot, DreamPRM@4, DreamPRM@2, DreamPRM@8) across five datasets (MathVista, WeMath, MMStar, MMVet, MathVision). Performance is measured on a radial scale from 0 to 70, with each dataset represented as an axis. The chart uses four distinct colored lines to visualize performance trends.
### Components/Axes
- **Legend**: Located at the bottom center, with four entries:
- Orange: Zero-shot
- Pink: DreamPRM@4
- Red: DreamPRM@2
- Blue: DreamPRM@8
- **Axes**: Five radial axes labeled clockwise:
1. MathVista (top)
2. WeMath (top-right)
3. MMStar (bottom-right)
4. MMVet (bottom)
5. MathVision (bottom-left)
- **Radial Scale**: Incremental markers from 0 to 70, with dashed lines for intermediate values.
### Detailed Analysis
1. **Zero-shot (Orange)**:
- MathVista: 20.0
- WeMath: 51.7
- MMStar: 58.0
- MMVet: 55.9
- MathVision: 20.0
- *Trend*: Lowest values across all datasets, with a sharp drop in MathVista and MathVision.
2. **DreamPRM@4 (Pink)**:
- MathVista: 66.5
- WeMath: 54.5
- MMStar: 60.0
- MMVet: 60.4
- MathVision: 65.4
- *Trend*: Moderate performance, consistently above Zero-shot but below DreamPRM@8.
3. **DreamPRM@2 (Red)**:
- MathVista: 55.3
- WeMath: 53.6
- MMStar: 59.3
- MMVet: 60.3
- MathVision: 60.4
- *Trend*: Slightly better than DreamPRM@4 in MMVet and MathVision, but lower in MathVista.
4. **DreamPRM@8 (Blue)**:
- MathVista: 68.9
- WeMath: 57.4
- MMStar: 62.3
- MMVet: 61.4
- MathVision: 61.4
- *Trend*: Highest values across all datasets, with a pronounced peak in MathVista.
### Key Observations
- **Performance Hierarchy**: DreamPRM@8 > DreamPRM@4 > DreamPRM@2 > Zero-shot.
- **Dataset Variance**: MathVista shows the largest performance gap between configurations (48.9 between Zero-shot and DreamPRM@8).
- **Consistency**: DreamPRM@8 maintains the highest performance across all datasets, while Zero-shot performs worst in MathVista and MathVision.
- **Diminishing Returns**: The performance gap between DreamPRM@4 and DreamPRM@8 narrows in WeMath (3.9) and MMStar (3.3) compared to MathVista (12.4).
### Interpretation
The data demonstrates that increasing the number of prompts (from 2 to 8) significantly improves model performance, particularly in complex tasks like MathVista. The Zero-shot configuration struggles across all datasets, suggesting that prompt engineering is critical for scaling ability. DreamPRM@8 achieves near-optimal results, with MathVista serving as a key differentiator where it outperforms other configurations by 12.4 points. The consistent performance of DreamPRM@8 across datasets implies robustness, while the variability in DreamPRM@4 and DreamPRM@2 highlights sensitivity to task complexity. This pattern underscores the importance of prompt quantity in scaling AI systems, with diminishing returns observed at higher prompt counts.