TECHNICAL ASSET FINGERPRINT
01844003b6f5a4d4a529aef7
Click to view fullscreen
Press ESC or click to close
FOUND IN PAPERS
EXPERT: gemini-2.5-flash-free VERSION 1
RUNTIME: google-free/gemini-2.5-flash
INTEL_VERIFIED
## Chart Type: Performance Metrics vs. Number of Actions
### Overview
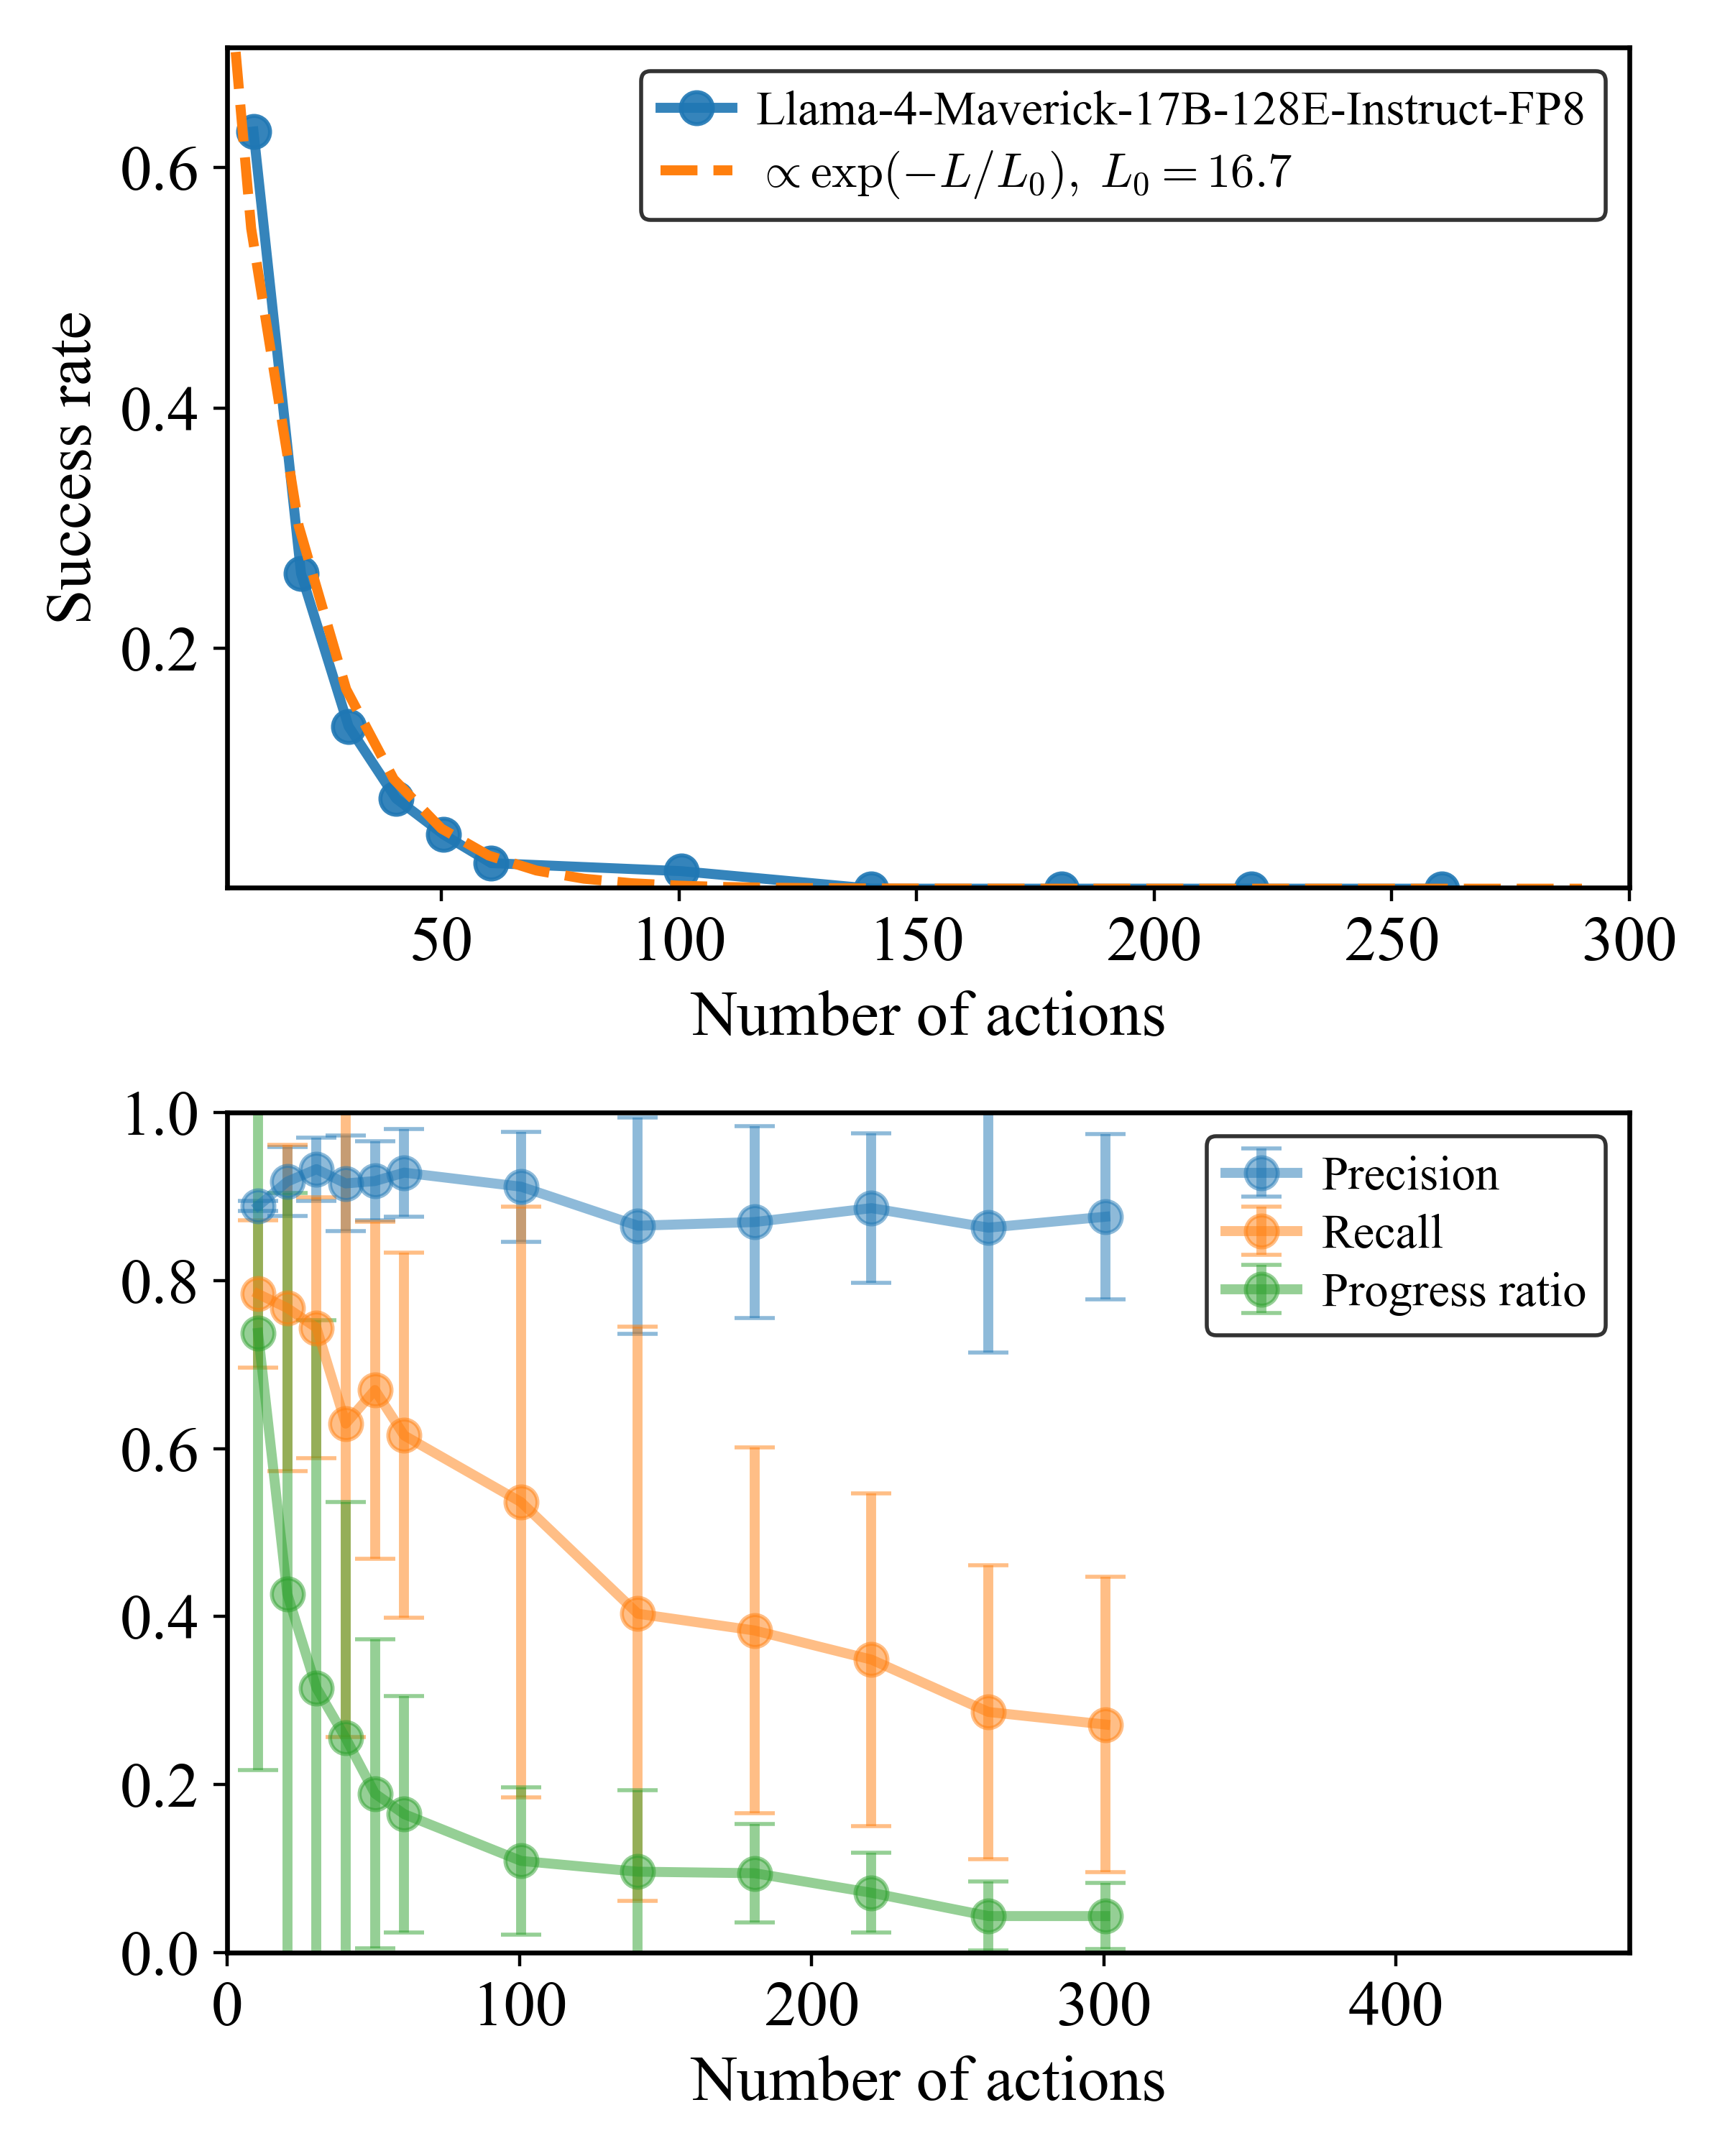
The image displays two separate line charts, stacked vertically, both illustrating performance metrics as a function of the "Number of actions". The top chart shows the "Success rate" of a specific model ("Llama-4-Maverick-17B-128E-Instruct-FP8") and an exponential decay fit. The bottom chart presents "Precision", "Recall", and "Progress ratio" with error bars for an unspecified system, also against the "Number of actions".
### Components/Axes
#### Top Chart: Success Rate
* **X-axis Label**: "Number of actions"
* **Range**: 0 to 300
* **Major Ticks**: 0, 50, 100, 150, 200, 250, 300
* **Y-axis Label**: "Success rate"
* **Range**: 0.0 to 0.6 (visually extends slightly above 0.6)
* **Major Ticks**: 0.0, 0.2, 0.4, 0.6
* **Legend (Top-right quadrant)**:
* **Blue line with circular markers**: "Llama-4-Maverick-17B-128E-Instruct-FP8"
* **Orange dashed line**: "∝ exp(−L/L₀), L₀ = 16.7"
#### Bottom Chart: Precision, Recall, Progress Ratio
* **X-axis Label**: "Number of actions"
* **Range**: 0 to 400
* **Major Ticks**: 0, 100, 200, 300, 400
* **Y-axis Label**: (Implicitly a ratio or score, ranging from 0.0 to 1.0)
* **Range**: 0.0 to 1.0
* **Major Ticks**: 0.0, 0.2, 0.4, 0.6, 0.8, 1.0
* **Legend (Top-right quadrant)**:
* **Blue line with circular markers and error bars**: "Precision"
* **Orange line with circular markers and error bars**: "Recall"
* **Green line with circular markers and error bars**: "Progress ratio"
### Detailed Analysis
#### Top Chart: Success Rate
The chart shows a rapid decrease in success rate as the number of actions increases.
* **Llama-4-Maverick-17B-128E-Instruct-FP8 (Blue line with circular markers)**:
* **Trend**: Starts at a high success rate and rapidly declines, approaching zero.
* **Data Points (approximate)**:
* At 0 actions: ~0.65 success rate
* At ~10 actions: ~0.62
* At ~20 actions: ~0.50
* At ~30 actions: ~0.26
* At ~40 actions: ~0.12
* At ~50 actions: ~0.05
* At ~60 actions: ~0.02
* At ~70 actions: ~0.01
* At ~80 actions: ~0.005
* At 100 actions: ~0.002
* Beyond 100 actions, the success rate remains very close to 0, with minor fluctuations (e.g., ~0.001 at 180, 230, 280 actions).
* **∝ exp(−L/L₀), L₀ = 16.7 (Orange dashed line)**:
* **Trend**: This exponential decay model closely follows the observed success rate of the Llama-4-Maverick model, indicating a good fit.
* **Data Points**: Visually, the orange dashed line is almost indistinguishable from the blue line, especially for the initial rapid decay phase.
#### Bottom Chart: Precision, Recall, Progress Ratio
This chart displays three metrics with associated error bars, showing their behavior as the number of actions increases.
* **Precision (Blue line with circular markers and error bars)**:
* **Trend**: Starts high, shows a slight initial dip, then stabilizes at a high level. The error bars are relatively small and consistent.
* **Data Points (approximate mean and error range)**:
* At 0 actions: ~0.90 (range ~0.85-0.95)
* At ~20 actions: ~0.90 (range ~0.85-0.95)
* At ~40 actions: ~0.90 (range ~0.85-0.95)
* At ~60 actions: ~0.90 (range ~0.85-0.95)
* At ~80 actions: ~0.88 (range ~0.80-0.95)
* At ~120 actions: ~0.88 (range ~0.80-0.95)
* At ~160 actions: ~0.88 (range ~0.80-0.95)
* At ~200 actions: ~0.88 (range ~0.80-0.95)
* At ~240 actions: ~0.88 (range ~0.80-0.95)
* At ~280 actions: ~0.88 (range ~0.80-0.95)
* **Recall (Orange line with circular markers and error bars)**:
* **Trend**: Starts high, decreases significantly and steadily, with increasing uncertainty (larger error bars) as the number of actions grows.
* **Data Points (approximate mean and error range)**:
* At 0 actions: ~0.80 (range ~0.70-0.90)
* At ~20 actions: ~0.75 (range ~0.60-0.90)
* At ~40 actions: ~0.65 (range ~0.50-0.80)
* At ~60 actions: ~0.60 (range ~0.40-0.80)
* At ~80 actions: ~0.55 (range ~0.30-0.75)
* At ~120 actions: ~0.40 (range ~0.20-0.60)
* At ~160 actions: ~0.38 (range ~0.15-0.60)
* At ~200 actions: ~0.35 (range ~0.10-0.55)
* At ~240 actions: ~0.30 (range ~0.05-0.50)
* At ~280 actions: ~0.28 (range ~0.05-0.50)
* **Progress ratio (Green line with circular markers and error bars)**:
* **Trend**: Starts at a moderate level, rapidly decreases, and then flattens out at a very low value. The error bars are initially very large, indicating high variability, and then shrink as the ratio approaches zero.
* **Data Points (approximate mean and error range)**:
* At 0 actions: ~0.45 (range ~0.00-0.80)
* At ~20 actions: ~0.30 (range ~0.00-0.60)
* At ~40 actions: ~0.20 (range ~0.00-0.40)
* At ~60 actions: ~0.15 (range ~0.00-0.30)
* At ~80 actions: ~0.12 (range ~0.00-0.25)
* At ~120 actions: ~0.10 (range ~0.00-0.20)
* At ~160 actions: ~0.09 (range ~0.00-0.18)
* At ~200 actions: ~0.08 (range ~0.00-0.15)
* At ~240 actions: ~0.07 (range ~0.00-0.15)
* At ~280 actions: ~0.07 (range ~0.00-0.15)
### Key Observations
* **Top Chart**: The success rate of the Llama-4-Maverick model drops very sharply with an increasing number of actions, indicating that its performance degrades significantly as the task complexity or length (represented by "Number of actions") increases. The exponential decay model provides an excellent fit for this observed behavior.
* **Bottom Chart**:
* **Precision** remains consistently high (around 0.88-0.90) across the range of actions, suggesting that when the system makes a positive prediction, it is usually correct. The low variability (small error bars) supports this consistency.
* **Recall** shows a substantial decline as the number of actions increases, indicating that the system becomes less able to identify all relevant instances. The increasing error bars suggest higher variability in recall at higher action counts.
* **Progress ratio** experiences the most dramatic drop, quickly approaching very low values. The large initial error bars highlight significant uncertainty in this metric for fewer actions.
### Interpretation
The two charts together likely illustrate the performance characteristics of a language model or an AI agent in tasks requiring a sequence of actions.
The **top chart** suggests that the "Llama-4-Maverick" model has a very limited "memory" or "coherence horizon" for tasks involving sequential actions. Its "Success rate" plummets rapidly, implying that beyond a small number of actions (around 50-60), the model is highly unlikely to succeed. The exponential decay fit with L₀ = 16.7 indicates a characteristic length scale for its success, meaning that for every 16.7 actions, the success rate roughly halves. This points to a fundamental limitation in maintaining task coherence or state over extended sequences.
The **bottom chart** provides a more nuanced view of performance.
* The high and stable **Precision** suggests that when the system *does* attempt an action or make a prediction, it is often correct. This could mean the model is good at local decision-making or generating plausible outputs, even if it misses the overall goal.
* The declining **Recall** is a critical indicator. It implies that as the "Number of actions" increases, the system fails to identify or execute a growing proportion of the necessary steps or components to complete a task. This aligns with the "Success rate" drop in the top chart; if the system misses too many required actions, the overall task will fail. The increasing uncertainty in recall further suggests that this failure to recall or execute necessary steps becomes more erratic and unpredictable with longer action sequences.
* The rapidly decreasing **Progress ratio** likely measures how much of the task is completed or how much progress is made towards the goal. Its sharp decline and low final values, coupled with high initial variability, reinforce the idea that the system struggles to make substantial progress on tasks requiring many actions. The large error bars at lower action counts might indicate that for simpler tasks, the "progress" can be highly variable, perhaps depending on the specific task instance or initial conditions.
In essence, the system (likely the Llama-4-Maverick model or a similar agent) is precise in its individual actions but suffers from a severe recall problem and an inability to sustain progress over longer sequences of actions. This leads to a very low overall success rate for complex, multi-step tasks. The data highlights a common challenge in AI, particularly with large language models, where local coherence can be high (good precision), but global coherence and long-term planning (good recall and progress) remain difficult.
DECODING INTELLIGENCE...