\n
## Charts: Performance Metrics vs. Number of Actions
### Overview
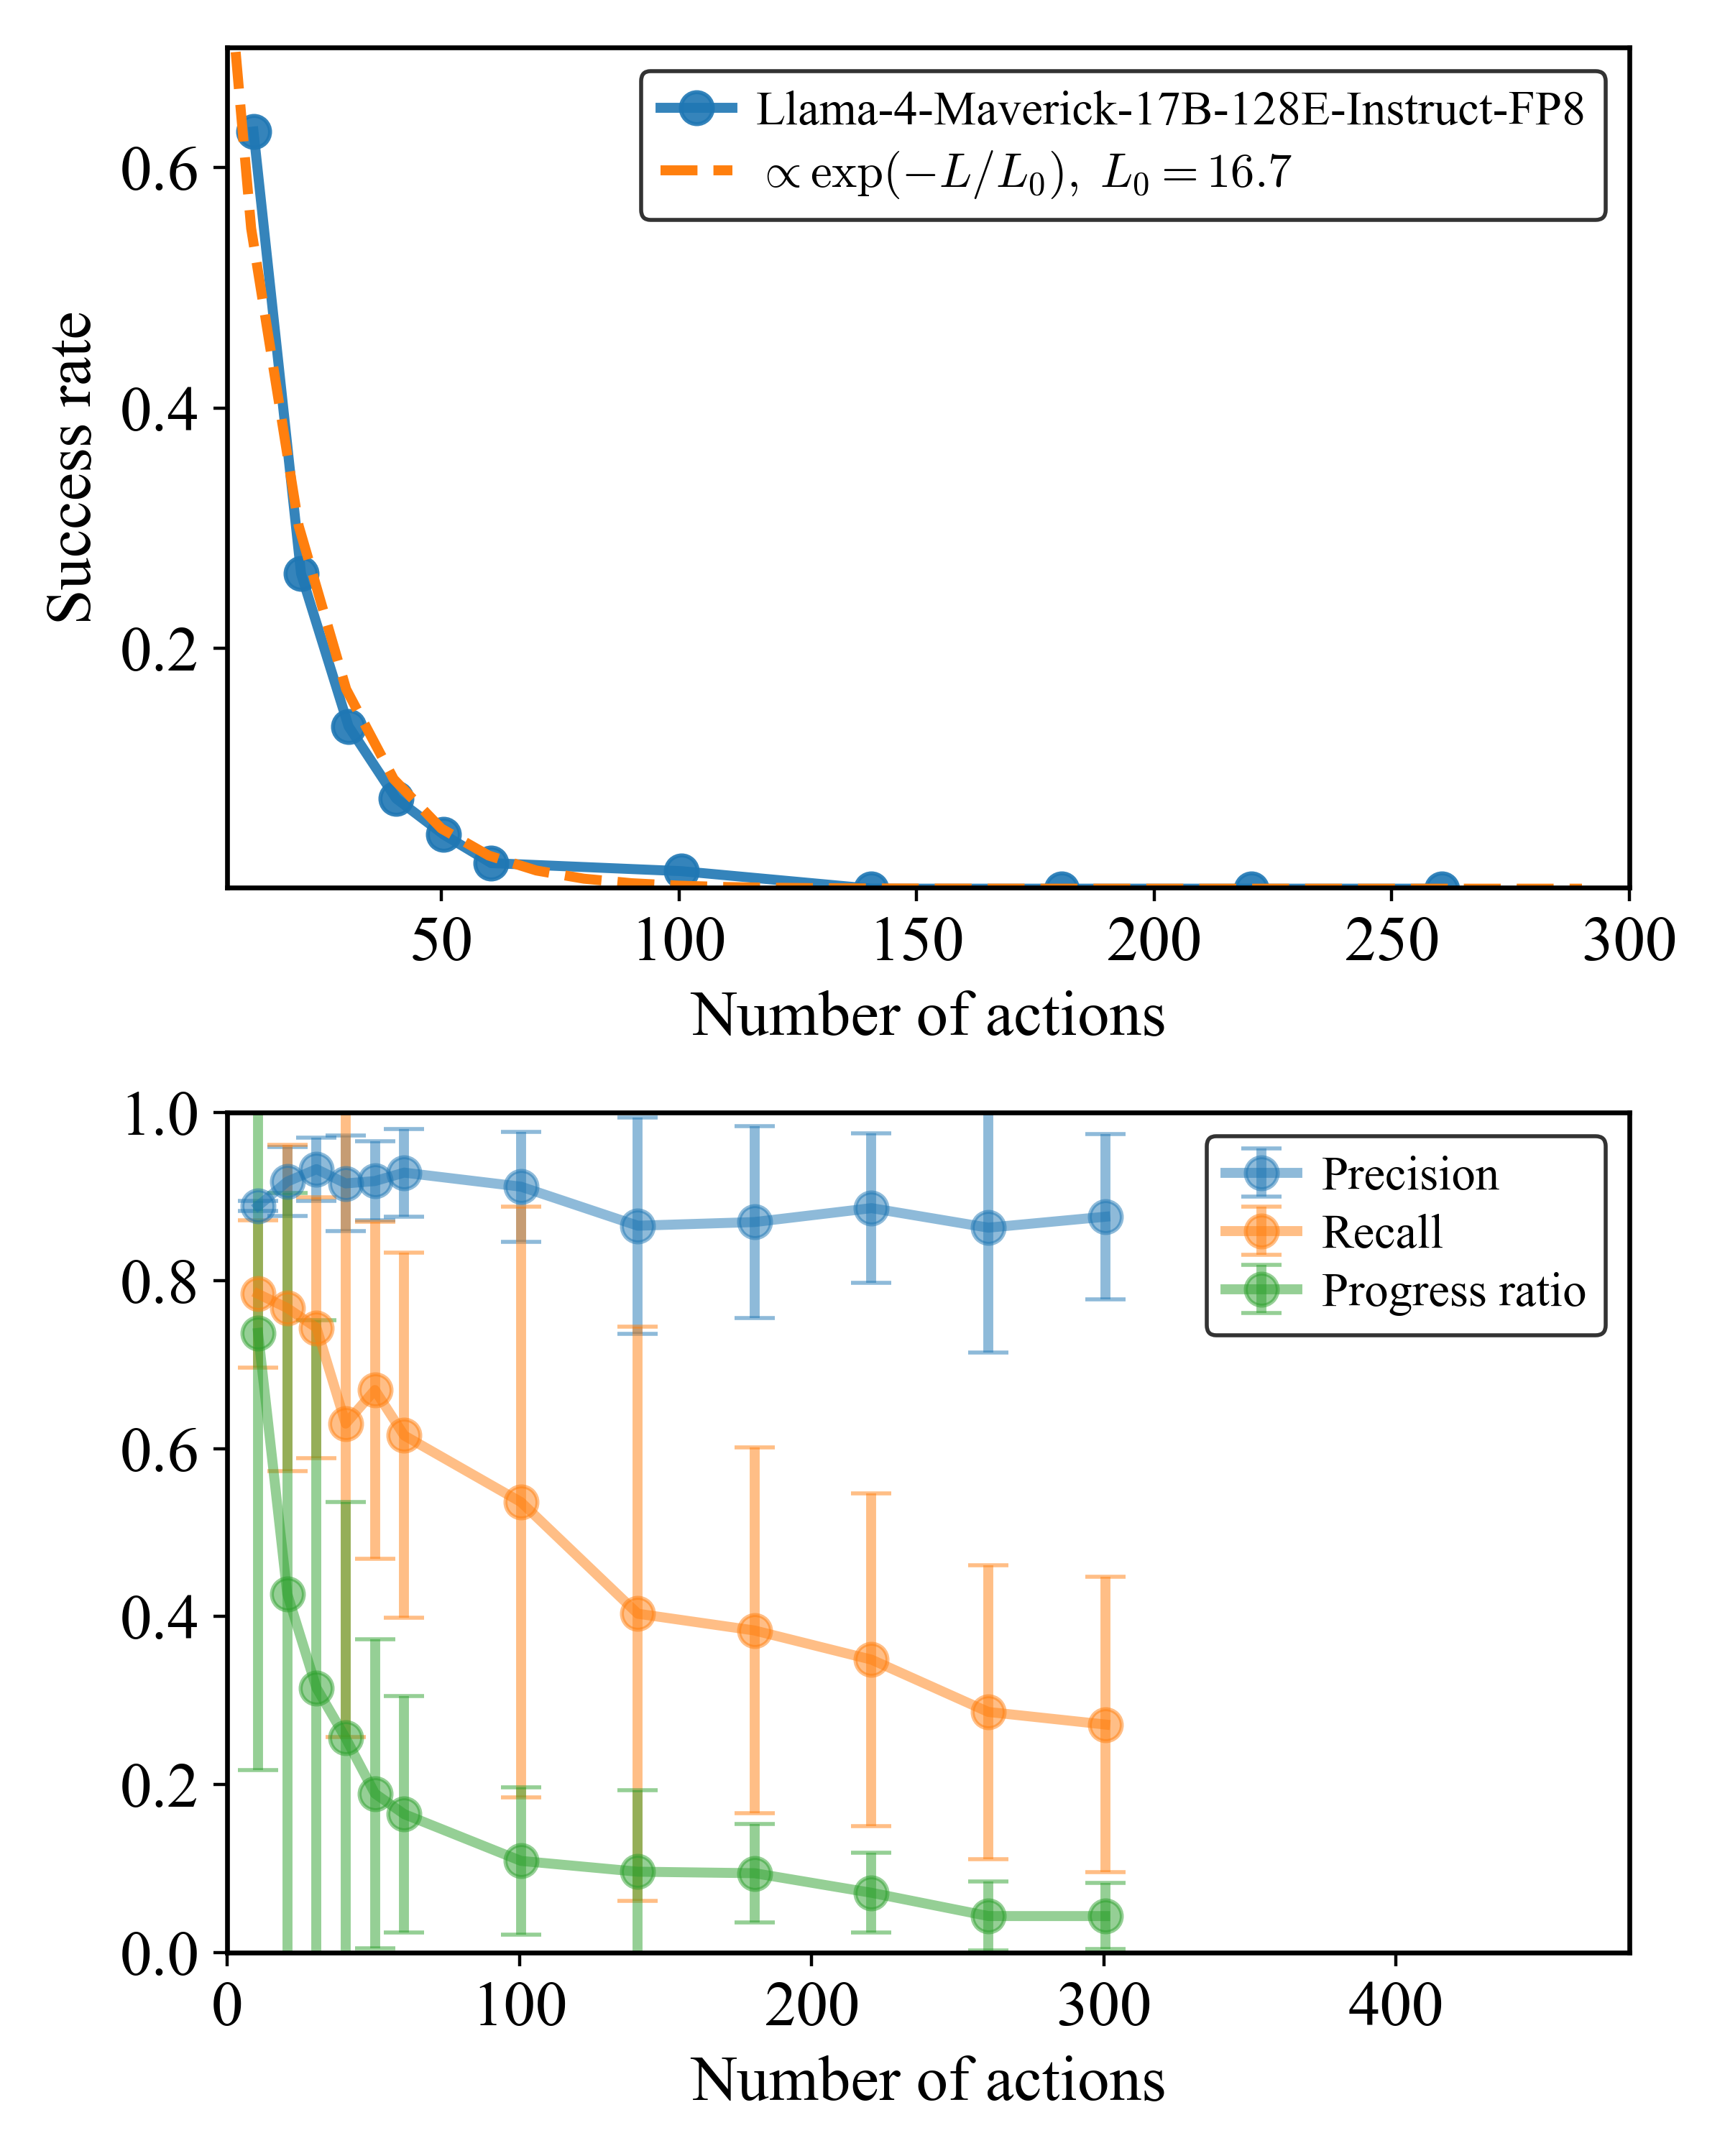
The image contains two charts displaying performance metrics related to a language model (Llama-4-Maverick-17B-128E-Instruct-FP8) as a function of the number of actions taken. The top chart shows the success rate, while the bottom chart displays precision, recall, and progress ratio. Both charts share the x-axis representing the number of actions.
### Components/Axes
**Top Chart:**
* **X-axis:** Number of actions (Scale: 0 to 300, increments of 50)
* **Y-axis:** Success rate (Scale: 0 to 0.6, increments of 0.1)
* **Data Series:**
* Llama-4-Maverick-17B-128E-Instruct-FP8 (Blue line with circle markers)
* α exp(-L/L₀), L₀ = 16.7 (Orange dashed line)
* **Legend:** Located at the top-right corner.
**Bottom Chart:**
* **X-axis:** Number of actions (Scale: 0 to 400, increments of 100)
* **Y-axis:** Metric Value (Scale: 0 to 1.0, increments of 0.2)
* **Data Series:**
* Precision (Blue line with circle markers)
* Recall (Orange line with circle markers)
* Progress ratio (Green line with circle markers)
* **Legend:** Located at the top-right corner.
### Detailed Analysis or Content Details
**Top Chart:**
The blue line representing Llama-4-Maverick-17B-128E-Instruct-FP8 starts at approximately 0.65 success rate at 0 actions and rapidly decreases to approximately 0.15 at 50 actions. It continues to decline slowly, reaching approximately 0.08 at 300 actions.
The orange dashed line starts at approximately 0.65 at 0 actions and decreases more gradually than the blue line, reaching approximately 0.25 at 300 actions.
**Bottom Chart:**
* **Precision (Blue):** Starts at approximately 0.9 at 0 actions and remains relatively stable around 0.85-0.95 throughout the range of actions, with some fluctuations.
* **Recall (Orange):** Starts at approximately 0.8 at 0 actions and decreases steadily to approximately 0.15 at 100 actions. It continues to decline, reaching approximately 0.08 at 300 actions.
* **Progress Ratio (Green):** Starts at approximately 0.2 at 0 actions and decreases rapidly to approximately 0.1 at 50 actions. It continues to decline, reaching approximately 0.05 at 300 actions. Each data point has a significant error bar, indicating high variance.
### Key Observations
* The success rate (top chart) decreases significantly with an increasing number of actions.
* Precision remains relatively high and stable across all actions.
* Recall and progress ratio (bottom chart) both decrease substantially with an increasing number of actions.
* The error bars on the recall and progress ratio suggest considerable variability in these metrics.
* The orange dashed line in the top chart provides a baseline for the success rate decay.
### Interpretation
The data suggests that while the language model starts with a high success rate, its performance deteriorates as the number of actions increases. Precision remains consistently high, indicating that when the model does succeed, it is generally correct. However, the decreasing recall and progress ratio suggest that the model becomes less capable of finding solutions or making progress as more actions are taken. The rapid initial drop in success rate, recall, and progress ratio could indicate an initial period of exploration or learning, followed by diminishing returns. The high variance in recall and progress ratio suggests that the model's performance is sensitive to the specific task or environment. The comparison to the exponential decay function (orange dashed line) in the top chart suggests that the success rate decay follows a similar pattern. This could be used to model or predict the model's performance over time.