## Line Graph: Success Rate vs. Number of Actions
### Overview
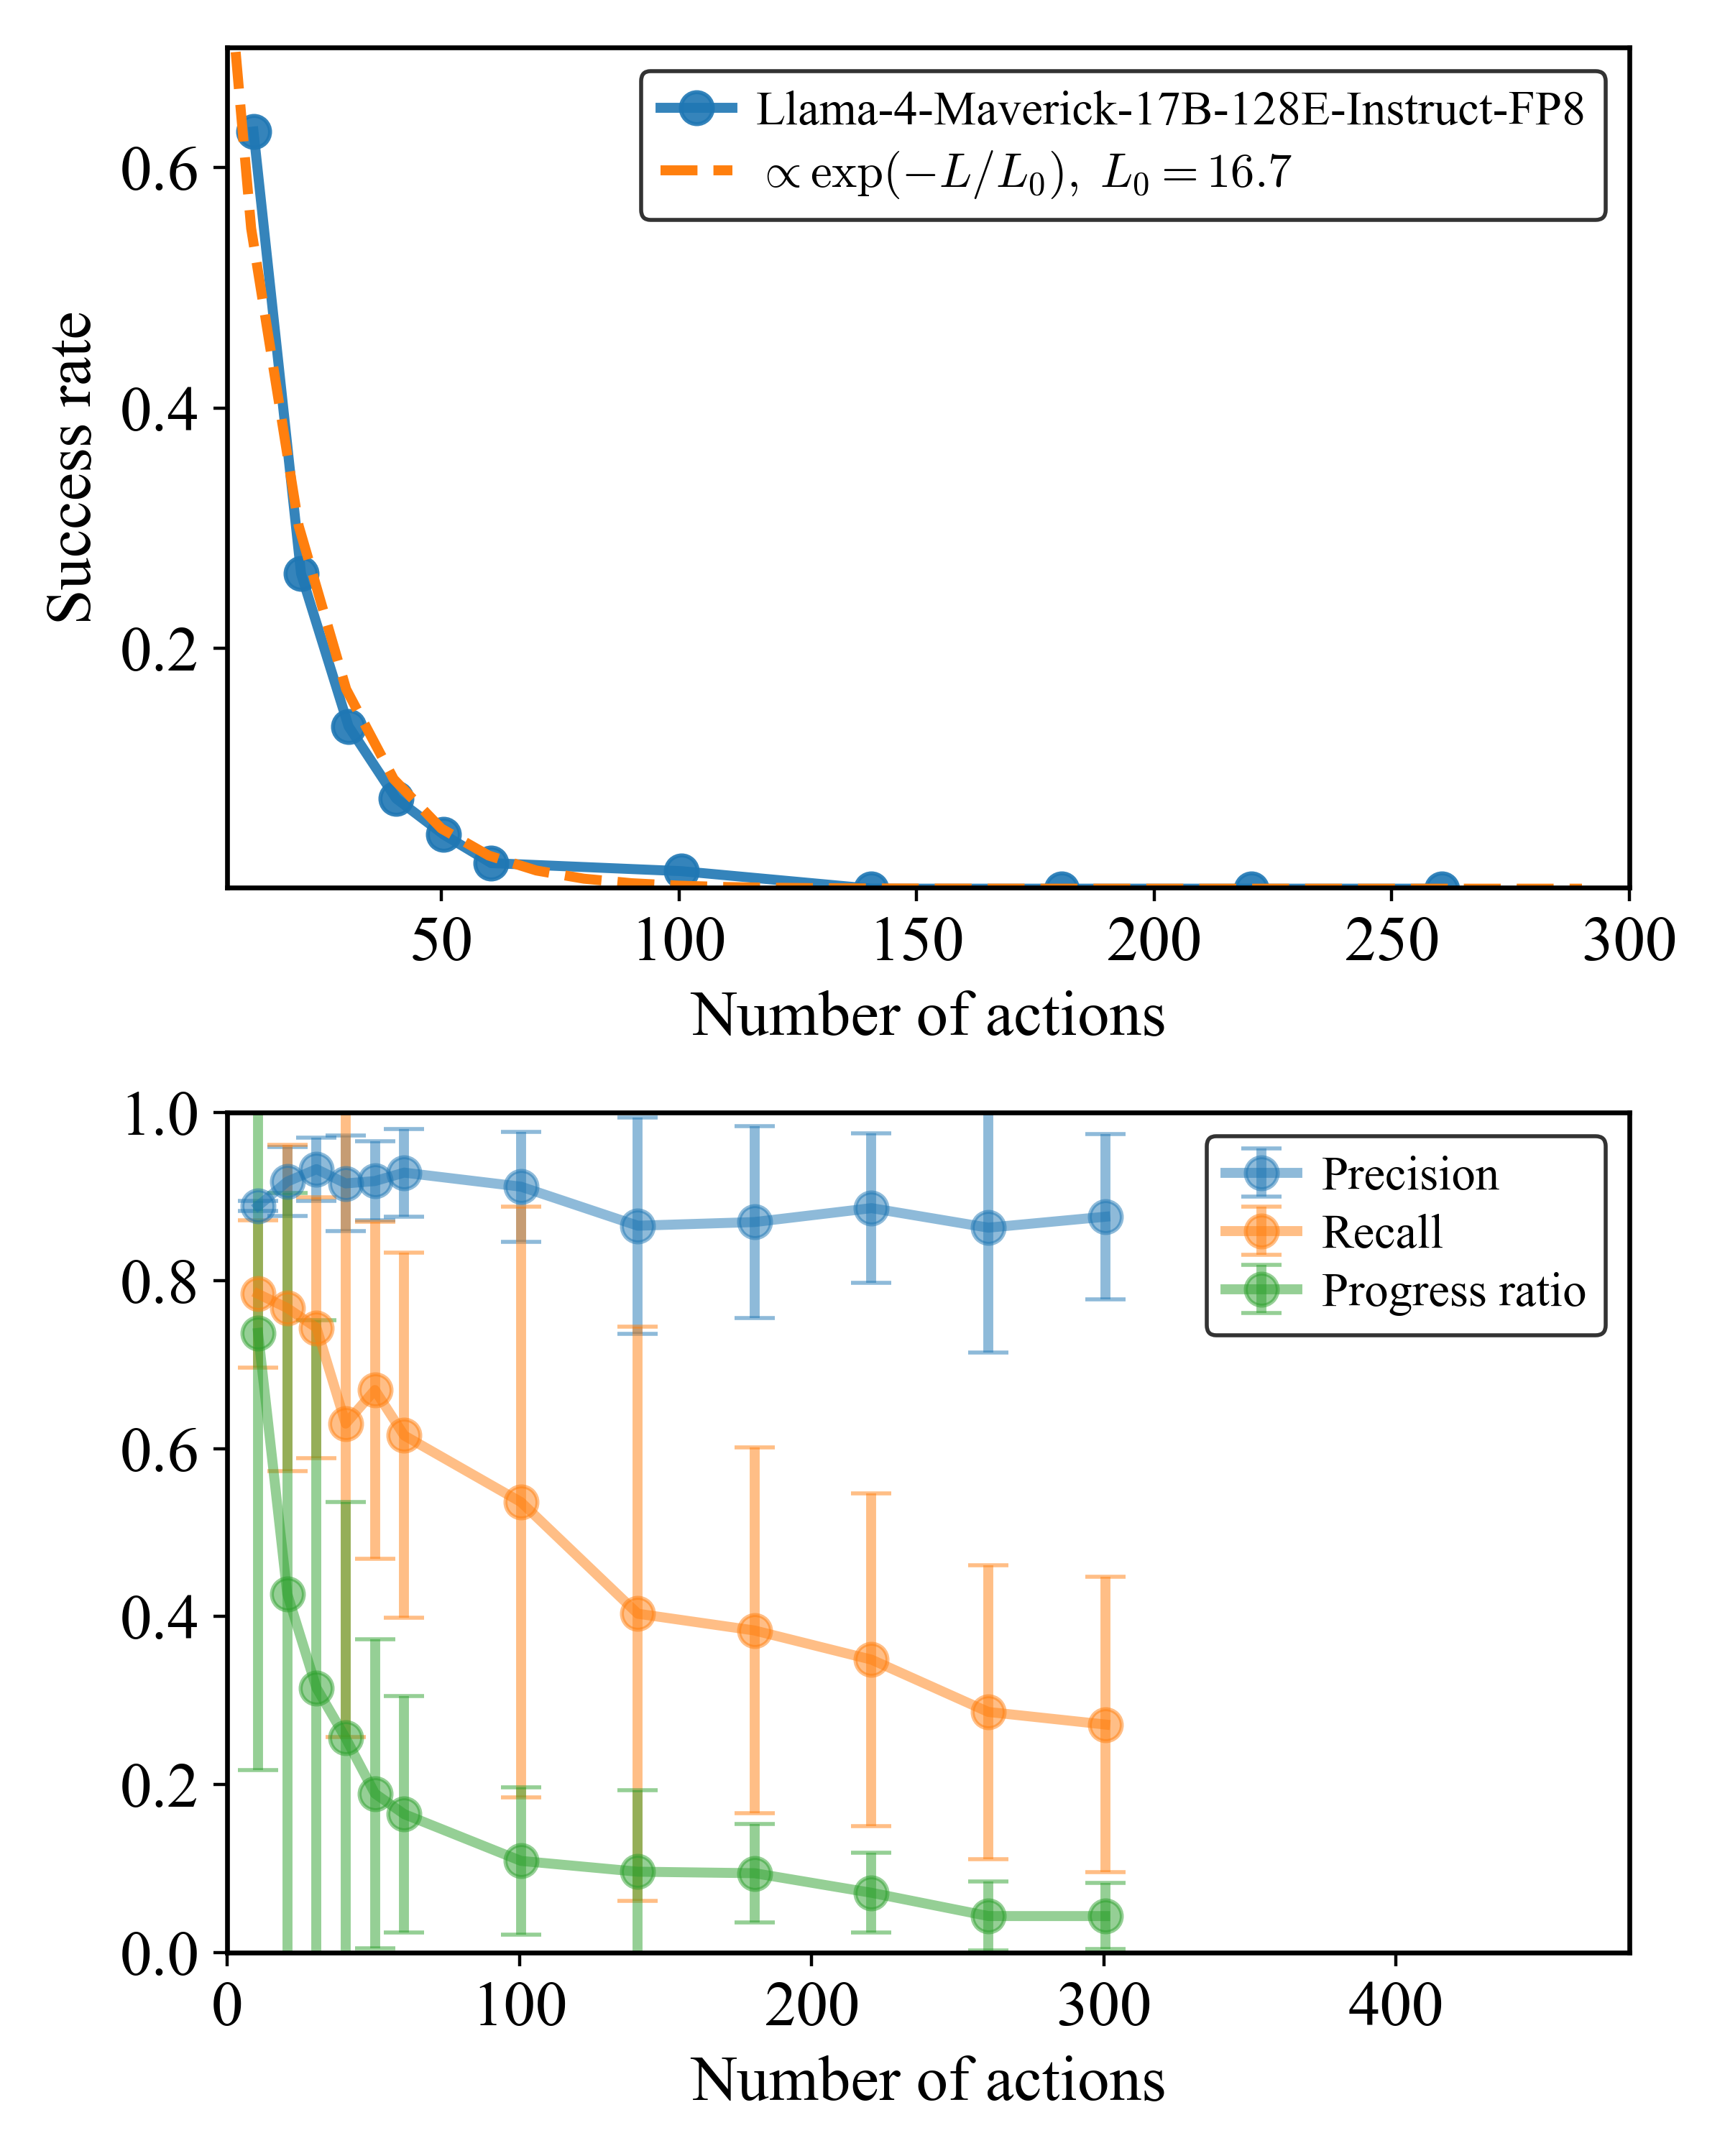
The image contains two charts. The top chart is a line graph comparing a model's success rate to the number of actions, with an exponential decay model overlaid. The bottom chart is a bar graph showing three metrics (Precision, Recall, Progress ratio) across the same action range, with error bars.
### Components/Axes
**Top Chart**:
- **X-axis**: "Number of actions" (0 to 300, linear scale).
- **Y-axis**: "Success rate" (0 to 0.6, linear scale).
- **Legend**:
- Blue line: "Llama-4-Maverick-17B-128E-Instruct-FP8" (actual data).
- Orange dashed line: "∝ exp(−L/L₀), L₀ = 16.7" (exponential decay model).
**Bottom Chart**:
- **X-axis**: "Number of actions" (0 to 400, linear scale).
- **Y-axis**: Metric values (0 to 1.0, linear scale).
- **Legend**:
- Blue circles: "Precision" (mean ± error bars).
- Orange circles: "Recall" (mean ± error bars).
- Green circles: "Progress ratio" (mean ± error bars).
### Detailed Analysis
**Top Chart**:
- The blue line (actual data) starts at ~0.62 success rate at 0 actions and decays exponentially, closely following the orange dashed model line.
- Key data points:
- At 0 actions: ~0.62 (blue), ~0.62 (orange).
- At 50 actions: ~0.25 (blue), ~0.25 (orange).
- At 100 actions: ~0.05 (blue), ~0.05 (orange).
- At 150+ actions: ~0.01 (blue), ~0.01 (orange).
**Bottom Chart**:
- **Precision**:
- Stable at ~0.9 across all actions, with small error bars (±0.02–0.05).
- **Recall**:
- Starts at ~0.8 at 0 actions, declines to ~0.3 at 300 actions.
- Error bars increase with actions (e.g., ±0.1 at 100 actions, ±0.2 at 300 actions).
- **Progress ratio**:
- Starts at ~0.75 at 0 actions, declines to ~0.1 at 300 actions.
- Error bars are large (e.g., ±0.1 at 100 actions, ±0.2 at 300 actions).
### Key Observations
1. **Exponential decay**: The top chart confirms the model’s success rate follows an exponential decay with a characteristic length scale L₀ = 16.7.
2. **Metric divergence**: Precision remains high, but Recall and Progress ratio degrade significantly over actions.
3. **Error variability**: Recall and Progress ratio exhibit higher uncertainty (larger error bars) compared to Precision.
### Interpretation
- The exponential decay in success rate suggests the model’s performance degrades predictably with increased actions, likely due to task complexity or data distribution shifts.
- The divergence between Precision (stable) and Recall/Progress ratio (declining) implies the model maintains accuracy in predictions but struggles with completeness (Recall) and incremental improvement (Progress ratio).
- Large error bars for Recall and Progress ratio indicate high variability in these metrics, possibly due to sparse data or task-specific challenges.
- The model’s L₀ = 16.7 implies a "half-life" of ~16.7 actions, after which success rate halves. This quantifies the rate of performance degradation.