## Bar Chart: Normalized Performance Comparison
### Overview
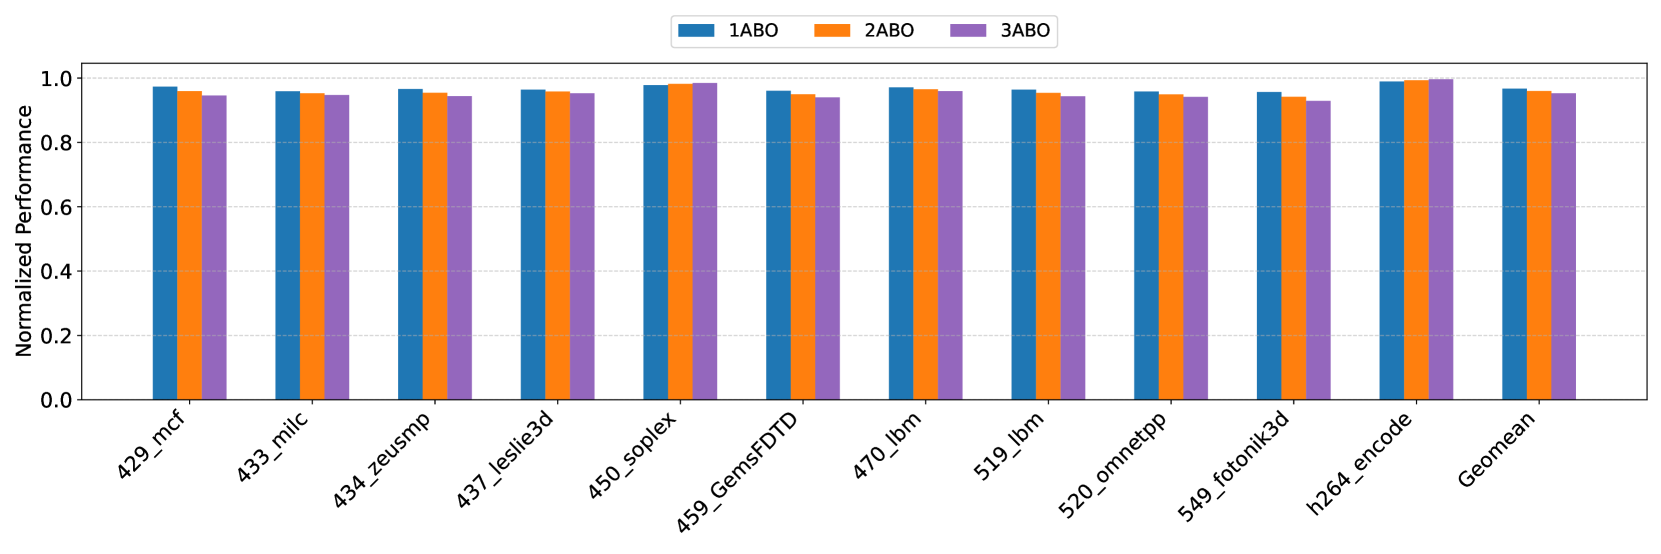
The image is a bar chart comparing the normalized performance of three configurations (1ABO, 2ABO, and 3ABO) across various benchmarks. The x-axis represents different benchmarks, while the y-axis represents the normalized performance, ranging from 0.0 to 1.0.
### Components/Axes
* **Title:** Normalized Performance
* **X-axis:** Benchmarks (429\_mcf, 433\_milc, 434\_zeusmp, 437\_leslie3d, 450\_soplex, 459\_GemsFDTD, 470\_lbm, 519\_lbm, 520\_omnetpp, 549\_fotonik3d, h264\_encode, Geomean)
* **Y-axis:** Normalized Performance (scale from 0.0 to 1.0, with increments of 0.2)
* **Legend:** Located at the top of the chart.
* Blue: 1ABO
* Orange: 2ABO
* Purple: 3ABO
### Detailed Analysis
The chart presents the normalized performance of three configurations (1ABO, 2ABO, and 3ABO) across twelve different benchmarks. The performance is normalized, meaning it's relative to a baseline, and the values range from 0.0 to 1.0.
Here's a breakdown of the performance for each benchmark:
* **429\_mcf:**
* 1ABO (Blue): ~0.98
* 2ABO (Orange): ~0.97
* 3ABO (Purple): ~0.95
* **433\_milc:**
* 1ABO (Blue): ~0.96
* 2ABO (Orange): ~0.96
* 3ABO (Purple): ~0.95
* **434\_zeusmp:**
* 1ABO (Blue): ~0.97
* 2ABO (Orange): ~0.96
* 3ABO (Purple): ~0.95
* **437\_leslie3d:**
* 1ABO (Blue): ~0.97
* 2ABO (Orange): ~0.96
* 3ABO (Purple): ~0.96
* **450\_soplex:**
* 1ABO (Blue): ~0.98
* 2ABO (Orange): ~0.99
* 3ABO (Purple): ~0.99
* **459\_GemsFDTD:**
* 1ABO (Blue): ~0.97
* 2ABO (Orange): ~0.96
* 3ABO (Purple): ~0.95
* **470\_lbm:**
* 1ABO (Blue): ~0.98
* 2ABO (Orange): ~0.97
* 3ABO (Purple): ~0.97
* **519\_lbm:**
* 1ABO (Blue): ~0.97
* 2ABO (Orange): ~0.96
* 3ABO (Purple): ~0.95
* **520\_omnetpp:**
* 1ABO (Blue): ~0.96
* 2ABO (Orange): ~0.95
* 3ABO (Purple): ~0.94
* **549\_fotonik3d:**
* 1ABO (Blue): ~0.96
* 2ABO (Orange): ~0.94
* 3ABO (Purple): ~0.93
* **h264\_encode:**
* 1ABO (Blue): ~0.99
* 2ABO (Orange): ~1.00
* 3ABO (Purple): ~0.99
* **Geomean:**
* 1ABO (Blue): ~0.97
* 2ABO (Orange): ~0.97
* 3ABO (Purple): ~0.96
### Key Observations
* The performance across all benchmarks is relatively high, with most values above 0.9.
* The configurations (1ABO, 2ABO, and 3ABO) show similar performance across most benchmarks.
* The 'h264\_encode' benchmark shows the highest performance, with 2ABO reaching a normalized performance of 1.0.
* The '549\_fotonik3d' benchmark shows the lowest performance compared to other benchmarks.
### Interpretation
The data suggests that the three configurations (1ABO, 2ABO, and 3ABO) have comparable performance across the tested benchmarks. The normalized performance values indicate that all configurations are performing well relative to the baseline used for normalization. The small variations in performance between the configurations suggest that the specific benchmark has a greater impact on performance than the configuration itself. The 'h264\_encode' benchmark appears to be particularly well-suited for these configurations, while '549\_fotonik3d' may present some challenges. Overall, the chart indicates that the configurations are optimized for a range of workloads, with minor differences in their effectiveness for specific tasks.