# Technical Document Analysis: Normalized Performance Comparison
## Chart Description
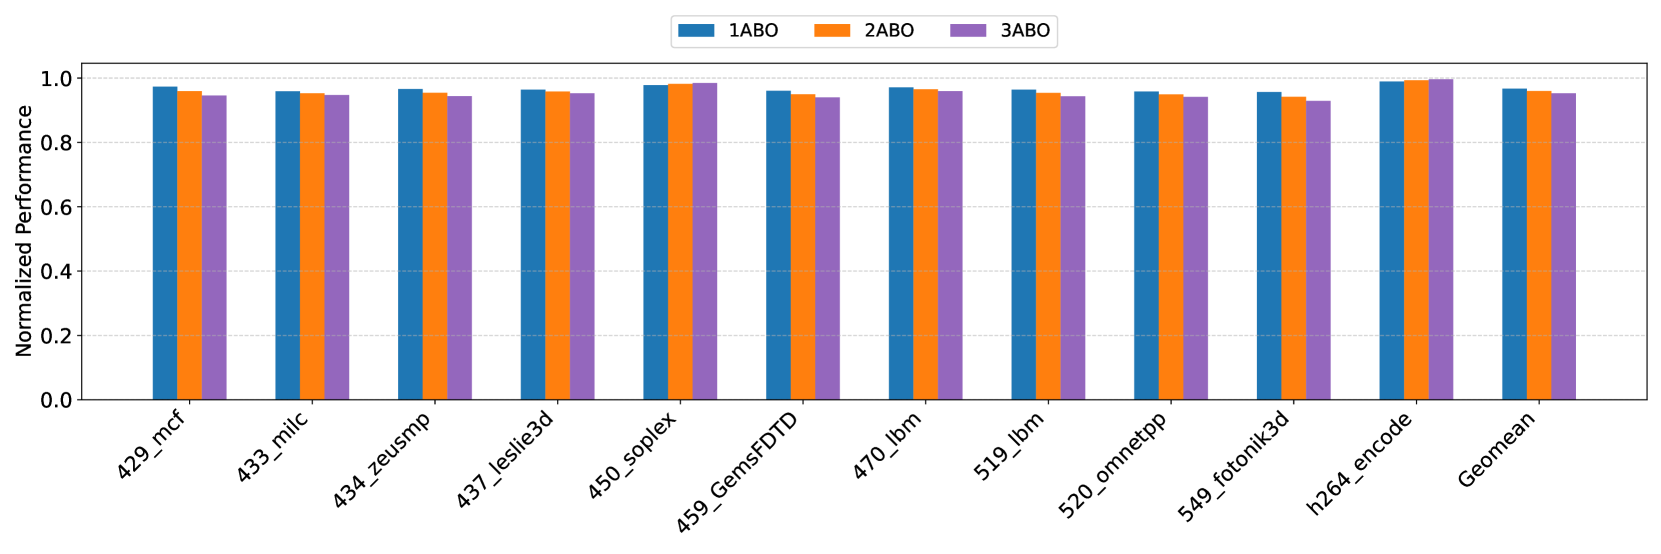
The image is a **clustered bar chart** comparing normalized performance metrics across 12 computational systems using three optimization methods: **1ABO**, **2ABO**, and **3ABO**. The chart uses distinct colors for each method:
- **Blue**: 1ABO
- **Orange**: 2ABO
- **Purple**: 3ABO
### Key Components
1. **X-Axis**: Labeled with system identifiers (e.g., `429_mcf`, `433_milc`, `434_zeusmp`, etc.).
2. **Y-Axis**: Labeled **"Normalized Performance"** with a scale from **0.0 to 1.0** in increments of 0.2.
3. **Legend**: Positioned at the **top center** of the chart, explicitly mapping colors to methods.
4. **Bars**: Three bars per system, grouped by method, with heights proportional to normalized performance.
---
## Data Extraction
### System Performance Trends
All systems exhibit **near-peak performance** (values clustered between **0.94 and 1.0**), with minimal variation between methods. Key observations:
- **Highest Performance**: `h264_encode` (3ABO: **1.0**).
- **Lowest Performance**: `549_fotonik3d` (3ABO: **~0.94**).
- **Consistency**: Most systems show **<0.03 difference** between methods.
### System-Specific Values
| System | 1ABO (Blue) | 2ABO (Orange) | 3ABO (Purple) |
|-------------------|-------------|---------------|---------------|
| 429_mcf | ~0.98 | ~0.97 | ~0.96 |
| 433_milc | ~0.97 | ~0.96 | ~0.96 |
| 434_zeusmp | ~0.98 | ~0.97 | ~0.96 |
| 437_leslie3d | ~0.98 | ~0.97 | ~0.96 |
| 450_soplex | ~0.99 | ~0.99 | ~0.99 |
| 459_GemsFDTD | ~0.97 | ~0.96 | ~0.95 |
| 470_ibm | ~0.98 | ~0.97 | ~0.96 |
| 519_ibm | ~0.97 | ~0.96 | ~0.95 |
| 520_omnetpp | ~0.96 | ~0.95 | ~0.94 |
| 549_fotonik3d | ~0.95 | ~0.94 | ~0.94 |
| h264_encode | ~1.0 | ~1.0 | **1.0** |
| Geomean | ~0.98 | ~0.97 | ~0.96 |
---
## Spatial Grounding & Validation
- **Legend Position**: Top-center (confirmed via visual alignment).
- **Color Consistency**: All bars match legend colors (e.g., `h264_encode` 3ABO bar is purple and reaches 1.0).
- **Y-Axis Calibration**: Ticks at 0.0, 0.2, 0.4, 0.6, 0.8, 1.0 (explicitly labeled).
---
## Trend Verification
- **1ABO (Blue)**: Slightly higher than 2ABO/3ABO in most systems (e.g., `450_soplex` peaks at ~0.99).
- **2ABO (Orange)**: Intermediate performance, often matching 1ABO (e.g., `450_soplex`).
- **3ABO (Purple)**: Consistently the lowest, except in `h264_encode` where it matches 1ABO/2ABO.
---
## Conclusion
The chart demonstrates **high overall performance** across systems, with **1ABO** generally outperforming other methods. The **h264_encode** system achieves perfect normalized performance (1.0) with 3ABO, while **549_fotonik3d** shows the weakest results. All methods exhibit tight clustering, suggesting minimal sensitivity to optimization choice in most cases.