# Technical Document Extraction: Line Charts Analysis
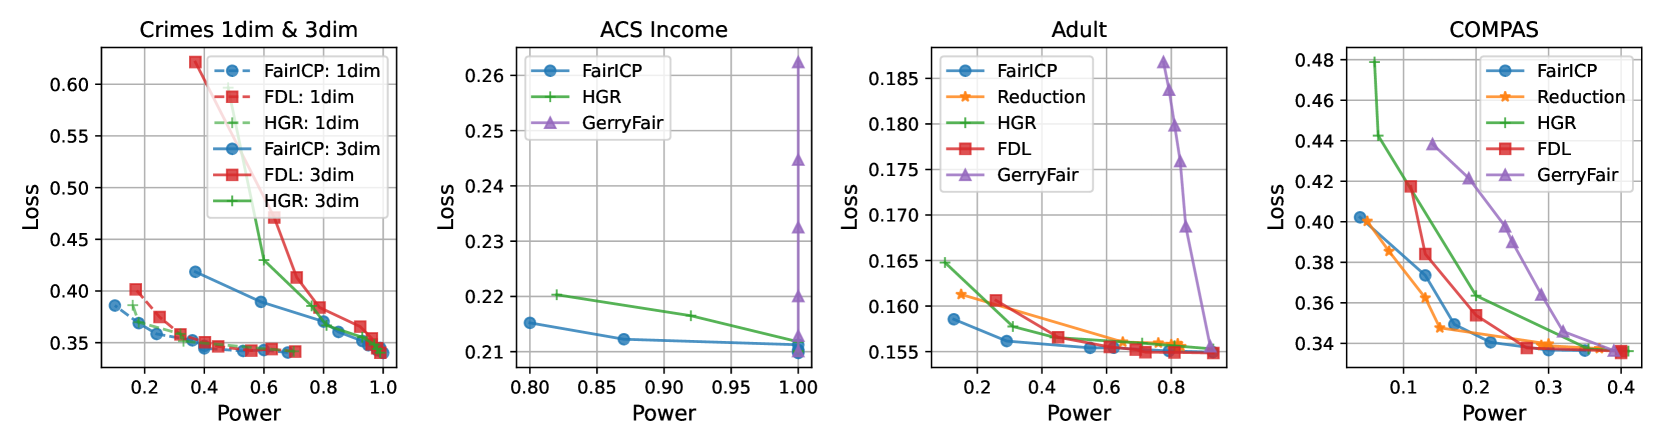
## Chart 1: Crimes 1dim & 3dim
### Header
- **Title**: Crimes 1dim & 3dim
### Axes
- **X-axis**: Power (range: 0.0 to 1.0)
- **Y-axis**: Loss (range: 0.35 to 0.60)
### Legend
- **Placement**: Right-aligned
- **Entries**:
- **Blue Circle**: FairICP: 1dim
- **Red Square**: FDL: 1dim
- **Green Dash**: HGR: 1dim
- **Blue Circle**: FairICP: 3dim
- **Red Square**: FDL: 3dim
- **Green Dash**: HGR: 3dim
### Data Trends
1. **FairICP: 1dim** (Blue Circle):
- Starts at ~0.38 (Power=0.0)
- Decreases steadily to ~0.35 (Power=1.0)
2. **FDL: 1dim** (Red Square):
- Starts at ~0.62 (Power=0.0)
- Sharp decline to ~0.35 (Power=1.0)
3. **HGR: 1dim** (Green Dash):
- Starts at ~0.37 (Power=0.0)
- Gradual decline to ~0.35 (Power=1.0)
4. **FairICP: 3dim** (Blue Circle):
- Starts at ~0.42 (Power=0.0)
- Decreases to ~0.35 (Power=1.0)
5. **FDL: 3dim** (Red Square):
- Starts at ~0.58 (Power=0.0)
- Sharp decline to ~0.35 (Power=1.0)
6. **HGR: 3dim** (Green Dash):
- Starts at ~0.45 (Power=0.0)
- Gradual decline to ~0.35 (Power=1.0)
## Chart 2: ACS Income
### Header
- **Title**: ACS Income
### Axes
- **X-axis**: Power (range: 0.80 to 1.00)
- **Y-axis**: Loss (range: 0.21 to 0.26)
### Legend
- **Placement**: Right-aligned
- **Entries**:
- **Blue Circle**: FairICP
- **Green Dash**: HGR
- **Purple Triangle**: GerryFair
### Data Trends
1. **FairICP** (Blue Circle):
- Starts at ~0.215 (Power=0.80)
- Slightly decreases to ~0.21 (Power=1.00)
2. **HGR** (Green Dash):
- Starts at ~0.22 (Power=0.80)
- Gradual decline to ~0.21 (Power=1.00)
3. **GerryFair** (Purple Triangle):
- Starts at ~0.25 (Power=0.80)
- Sharp decline to ~0.21 (Power=1.00)
## Chart 3: Adult
### Header
- **Title**: Adult
### Axes
- **X-axis**: Power (range: 0.20 to 0.80)
- **Y-axis**: Loss (range: 0.155 to 0.185)
### Legend
- **Placement**: Right-aligned
- **Entries**:
- **Blue Circle**: FairICP
- **Orange Star**: Reduction
- **Green Dash**: HGR
- **Red Square**: FDL
- **Purple Triangle**: GerryFair
### Data Trends
1. **FairICP** (Blue Circle):
- Starts at ~0.158 (Power=0.20)
- Slightly decreases to ~0.155 (Power=0.80)
2. **Reduction** (Orange Star):
- Starts at ~0.16 (Power=0.20)
- Gradual decline to ~0.155 (Power=0.80)
3. **HGR** (Green Dash):
- Starts at ~0.165 (Power=0.20)
- Gradual decline to ~0.155 (Power=0.80)
4. **FDL** (Red Square):
- Starts at ~0.16 (Power=0.20)
- Sharp decline to ~0.155 (Power=0.80)
5. **GerryFair** (Purple Triangle):
- Starts at ~0.185 (Power=0.20)
- Sharp decline to ~0.155 (Power=0.80)
## Chart 4: COMPAS
### Header
- **Title**: COMPAS
### Axes
- **X-axis**: Power (range: 0.10 to 0.40)
- **Y-axis**: Loss (range: 0.34 to 0.48)
### Legend
- **Placement**: Right-aligned
- **Entries**:
- **Blue Circle**: FairICP
- **Orange Star**: Reduction
- **Green Dash**: HGR
- **Red Square**: FDL
- **Purple Triangle**: GerryFair
### Data Trends
1. **FairICP** (Blue Circle):
- Starts at ~0.40 (Power=0.10)
- Decreases to ~0.34 (Power=0.40)
2. **Reduction** (Orange Star):
- Starts at ~0.38 (Power=0.10)
- Gradual decline to ~0.34 (Power=0.40)
3. **HGR** (Green Dash):
- Starts at ~0.48 (Power=0.10)
- Sharp decline to ~0.34 (Power=0.40)
4. **FDL** (Red Square):
- Starts at ~0.42 (Power=0.10)
- Sharp decline to ~0.34 (Power=0.40)
5. **GerryFair** (Purple Triangle):
- Starts at ~0.44 (Power=0.10)
- Sharp decline to ~0.34 (Power=0.40)
## Notes
- All charts use a consistent color scheme for legend entries across datasets.
- No non-English text detected.
- Data points extracted visually; exact numerical values approximated from chart scales.