# Technical Data Extraction: Model Performance Comparison
This document provides a detailed extraction of data from two side-by-side scatter plots comparing different machine learning adaptation methods across two datasets: **WikiSQL** and **MultiNLI-matched**.
## 1. General Metadata
* **Y-Axis Label:** Validation Accuracy (shared across both plots, though scales differ).
* **X-Axis Label:** $\log_{10}$ # Trainable Parameters (shared across both plots).
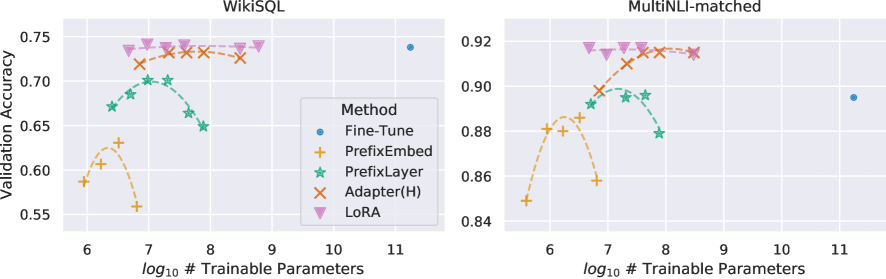
* **Legend Title:** Method
* **Legend Location:** Centered between the two plots (spatially grounded in the lower-right quadrant of the WikiSQL plot).
* **Legend Categories (Marker/Color):**
* **Fine-Tune:** Blue circle (●)
* **PrefixEmbed:** Orange plus sign (+)
* **PrefixLayer:** Green star (★)
* **Adapter(H):** Brown/Orange 'x' (✕)
* **LoRA:** Pink inverted triangle (▼)
---
## 2. Dataset 1: WikiSQL (Left Plot)
### Component Isolation: WikiSQL
* **Y-Axis Range:** 0.55 to 0.75.
* **X-Axis Range:** ~6.0 to ~11.5.
### Trend Analysis and Data Points
* **Fine-Tune (Blue Circle):**
* *Trend:* A single baseline point at the far right of the scale.
* *Data Point:* Approximately [11.2, 0.74].
* **LoRA (Pink Inverted Triangle):**
* *Trend:* Flat/Stable. Maintains the highest accuracy across a wide range of parameters.
* *Data Points:* Five points ranging from $\log_{10} \approx 6.5$ to $8.8$, all clustered tightly around a validation accuracy of **0.74**.
* **Adapter(H) (Brown 'x'):**
* *Trend:* Slight arc. Performance is high and stable, slightly below LoRA.
* *Data Points:* Four points between $\log_{10} \approx 6.8$ and $8.5$, with accuracy peaking near **0.73**.
* **PrefixLayer (Green Star):**
* *Trend:* Parabolic/Inverted-U. Performance increases then drops sharply as parameters increase.
* *Data Points:* Five points between $\log_{10} \approx 6.4$ and $7.9$. Peak accuracy is ~**0.70** at $\log_{10} \approx 7.2$.
* **PrefixEmbed (Orange Plus):**
* *Trend:* Sharp Parabolic. Lowest overall performance with a narrow peak.
* *Data Points:* Four points between $\log_{10} \approx 6.0$ and $6.8$. Peak accuracy is ~**0.63** at $\log_{10} \approx 6.5$.
---
## 3. Dataset 2: MultiNLI-matched (Right Plot)
### Component Isolation: MultiNLI-matched
* **Y-Axis Range:** 0.84 to 0.92.
* **X-Axis Range:** ~5.5 to ~11.5.
### Trend Analysis and Data Points
* **Fine-Tune (Blue Circle):**
* *Trend:* Single baseline point at the far right.
* *Data Point:* Approximately [11.2, 0.895].
* **LoRA (Pink Inverted Triangle):**
* *Trend:* Flat/Stable. Consistently the highest performing method.
* *Data Points:* Four points between $\log_{10} \approx 6.7$ and $8.5$, all maintaining an accuracy of ~**0.918**.
* **Adapter(H) (Brown 'x'):**
* *Trend:* Upward slope that plateaus.
* *Data Points:* Four points between $\log_{10} \approx 6.8$ and $8.5$. Accuracy starts at ~0.90 and rises to match LoRA at ~**0.915** at the highest parameter count.
* **PrefixLayer (Green Star):**
* *Trend:* Inverted-U.
* *Data Points:* Four points between $\log_{10} \approx 6.7$ and $7.9$. Peak accuracy is ~**0.898** at $\log_{10} \approx 7.2$, dropping to ~0.88 at $\log_{10} \approx 7.9$.
* **PrefixEmbed (Orange Plus):**
* *Trend:* Sharp Parabolic.
* *Data Points:* Five points between $\log_{10} \approx 5.6$ and $6.8$. Peak accuracy is ~**0.885** at $\log_{10} \approx 6.3$.
---
## 4. Summary of Comparative Findings
1. **Efficiency:** All adaptation methods (LoRA, Adapter, Prefix) achieve comparable or superior accuracy to full **Fine-Tuning** while using significantly fewer trainable parameters (roughly $10^6$ to $10^8$ vs $10^{11}$).
2. **Top Performer:** **LoRA** is the most robust method, showing the highest accuracy and the most stability across different parameter scales in both datasets.
3. **Parameter Sensitivity:** **PrefixEmbed** and **PrefixLayer** show significant performance degradation if the number of trainable parameters is increased beyond an optimal point (inverted-U shape), whereas **LoRA** and **Adapter(H)** remain stable or improve with more parameters.