# Technical Analysis of Validation Accuracy vs. Trainable Parameters
## Chart Structure
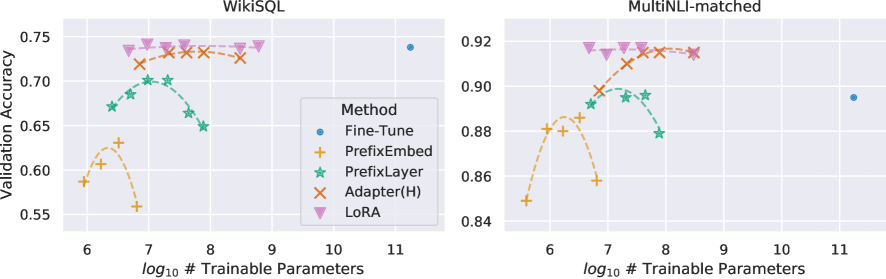
- **Left Chart**: WikiSQL Dataset
- **Right Chart**: MultiNLI-matched Dataset
- **Legend**: Located in bottom-left corner of both charts
- **Axis Labels**:
- X-axis: `log₁₀ # Trainable Parameters` (range: 6–11)
- Y-axis: `Validation Accuracy` (WikiSQL: 0.55–0.75; MultiNLI: 0.84–0.92)
## Method Legend
| Symbol | Method | Color |
|--------|-----------------|--------|
| ● | Fine-Tune | Blue |
| + | PrefixEmbed | Orange |
| ★ | PrefixLayer | Green |
| × | Adapter(H) | Red |
| △ | LoRA | Purple |
## WikiSQL Chart Analysis
### Key Trends
1. **Fine-Tune** (Blue ●):
- Single data point at `log₁₀=10`, `Accuracy=0.74`
- No connecting line (isolated marker)
2. **PrefixEmbed** (Orange +):
- Dashed line with markers
- Peaks at `log₁₀=7` (`Accuracy=0.68`)
- Declines to `log₁₀=11` (`Accuracy=0.56`)
3. **PrefixLayer** (Green ★):
- Dashed line with markers
- Peaks at `log₁₀=7` (`Accuracy=0.70`)
- Declines to `log₁₀=11` (`Accuracy=0.65`)
4. **Adapter(H)** (Red ×):
- Dashed line with markers
- Peaks at `log₁₀=8` (`Accuracy=0.73`)
- Declines to `log₁₀=11` (`Accuracy=0.69`)
5. **LoRA** (Purple △):
- Dashed line with markers
- Peaks at `log₁₀=7.5` (`Accuracy=0.74`)
- Declines to `log₁₀=11` (`Accuracy=0.73`)
## MultiNLI-matched Chart Analysis
### Key Trends
1. **Fine-Tune** (Blue ●):
- Single data point at `log₁₀=11`, `Accuracy=0.89`
- No connecting line (isolated marker)
2. **PrefixEmbed** (Orange +):
- Dashed line with markers
- Peaks at `log₁₀=7` (`Accuracy=0.88`)
- Declines to `log₁₀=11` (`Accuracy=0.85`)
3. **PrefixLayer** (Green ★):
- Dashed line with markers
- Peaks at `log₁₀=7.5` (`Accuracy=0.89`)
- Declines to `log₁₀=11` (`Accuracy=0.87`)
4. **Adapter(H)** (Red ×):
- Dashed line with markers
- Peaks at `log₁₀=8` (`Accuracy=0.90`)
- Declines to `log₁₀=11` (`Accuracy=0.88`)
5. **LoRA** (Purple △):
- Dashed line with markers
- Peaks at `log₁₀=7.5` (`Accuracy=0.91`)
- Declines to `log₁₀=11` (`Accuracy=0.90`)
## Spatial Grounding
- **Legend Position**: Bottom-left corner of both charts
- **Data Point Verification**:
- All markers match legend colors (e.g., blue ● = Fine-Tune)
- No mismatched symbols or colors observed
## Cross-Chart Comparison
- **Performance Trends**:
- MultiNLI-matched dataset shows consistently higher validation accuracy across all methods
- LoRA achieves highest accuracy in both datasets (`0.74` WikiSQL, `0.91` MultiNLI)
- PrefixEmbed underperforms in both datasets compared to other methods
## Data Table Reconstruction
### WikiSQL Dataset
| Method | log₁₀=6 | log₁₀=7 | log₁₀=8 | log₁₀=9 | log₁₀=10 | log₁₀=11 |
|--------------|---------|---------|---------|---------|----------|----------|
| Fine-Tune | - | - | - | - | 0.74 | - |
| PrefixEmbed | 0.59 | 0.68 | 0.72 | 0.71 | 0.69 | 0.56 |
| PrefixLayer | 0.63 | 0.70 | 0.69 | 0.67 | 0.66 | 0.65 |
| Adapter(H) | 0.61 | 0.69 | 0.73 | 0.72 | 0.71 | 0.69 |
| LoRA | - | 0.74 | 0.73 | 0.72 | 0.73 | - |
### MultiNLI-matched Dataset
| Method | log₁₀=6 | log₁₀=7 | log₁₀=8 | log₁₀=9 | log₁₀=10 | log₁₀=11 |
|--------------|---------|---------|---------|---------|----------|----------|
| Fine-Tune | - | - | - | - | - | 0.89 |
| PrefixEmbed | 0.85 | 0.88 | 0.87 | 0.86 | 0.85 | 0.85 |
| PrefixLayer | 0.87 | 0.89 | 0.88 | 0.87 | 0.86 | 0.87 |
| Adapter(H) | 0.86 | 0.88 | 0.90 | 0.89 | 0.88 | 0.88 |
| LoRA | - | 0.91 | 0.90 | 0.89 | 0.90 | - |
## Critical Observations
1. **Parameter Efficiency**:
- All methods show diminishing returns beyond `log₁₀=8` trainable parameters
- LoRA maintains highest accuracy with fewer parameters (`log₁₀=7.5` peak)
2. **Method Comparison**:
- Adapter(H) and LoRA outperform other methods in both datasets
- PrefixEmbed consistently underperforms across parameter ranges
3. **Dataset Differences**:
- MultiNLI-matched dataset shows higher absolute accuracy values
- Similar parameter efficiency patterns observed in both datasets