## Line Chart: Better frontier with honesty control
### Overview
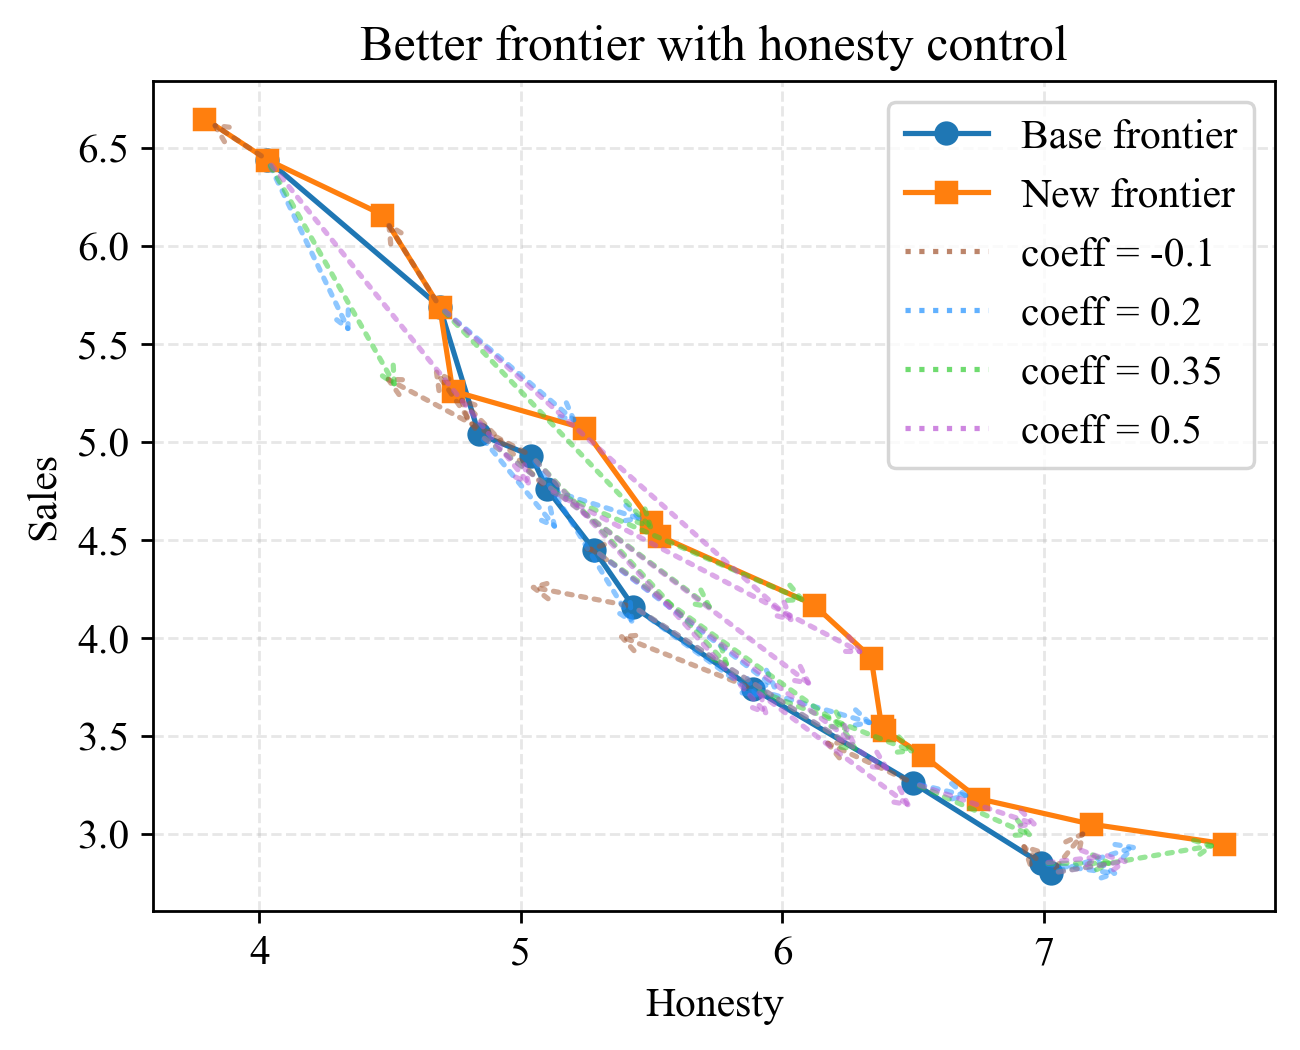
The image is a line chart comparing the "Base frontier" and "New frontier" in terms of "Sales" versus "Honesty". It also shows the impact of different coefficient values (coeff = -0.1, 0.2, 0.35, 0.5) on the frontier. The chart illustrates how sales change with honesty under different conditions.
### Components/Axes
* **Title:** Better frontier with honesty control
* **X-axis:** Honesty, ranging from 4 to 7 in increments of 1.
* **Y-axis:** Sales, ranging from 3.0 to 6.5 in increments of 0.5.
* **Legend:** Located in the top-right corner.
* Blue line with circle markers: Base frontier
* Orange line with square markers: New frontier
* Brown dotted line: coeff = -0.1
* Light blue dotted line: coeff = 0.2
* Green dotted line: coeff = 0.35
* Purple dotted line: coeff = 0.5
### Detailed Analysis
**Base frontier (Blue line with circle markers):**
The base frontier generally slopes downward.
* (4.0, 6.6)
* (5.0, 5.0)
* (5.5, 4.5)
* (6.0, 4.0)
* (6.5, 3.3)
* (7.0, 2.8)
**New frontier (Orange line with square markers):**
The new frontier also generally slopes downward.
* (4.0, 6.6)
* (4.5, 6.4)
* (5.0, 6.2)
* (5.0, 5.0)
* (5.5, 5.7)
* (6.0, 5.0)
* (6.5, 4.2)
* (7.0, 3.0)
**coeff = -0.1 (Brown dotted line):**
* (4.0, 6.4)
* (5.0, 4.3)
* (5.5, 4.0)
* (6.0, 3.8)
* (6.5, 3.5)
* (7.0, 2.9)
**coeff = 0.2 (Light blue dotted line):**
* (4.0, 6.4)
* (5.0, 4.8)
* (5.5, 4.4)
* (6.0, 4.0)
* (6.5, 3.7)
* (7.0, 2.9)
**coeff = 0.35 (Green dotted line):**
* (4.0, 5.6)
* (5.0, 5.1)
* (5.5, 4.6)
* (6.0, 4.2)
* (6.5, 3.8)
* (7.0, 2.9)
**coeff = 0.5 (Purple dotted line):**
* (4.0, 6.4)
* (5.0, 5.2)
* (5.5, 4.7)
* (6.0, 4.3)
* (6.5, 3.9)
* (7.0, 2.9)
### Key Observations
* Both the "Base frontier" and "New frontier" show a negative correlation between "Honesty" and "Sales". As honesty increases, sales tend to decrease.
* The "New frontier" generally has higher sales values than the "Base frontier" for the same level of honesty, up until an honesty level of approximately 5. After that, the "Base frontier" and "New frontier" converge.
* The different coefficient values (coeff = -0.1, 0.2, 0.35, 0.5) all show a similar downward trend, with varying degrees of impact on sales.
* The lines representing different coefficient values are clustered together, suggesting that the coefficient has a relatively small impact on the sales compared to the base and new frontiers.
### Interpretation
The chart suggests that increasing honesty may lead to a decrease in sales, as indicated by the downward sloping frontiers. The "New frontier" initially outperforms the "Base frontier," implying that some intervention or change has improved sales at lower levels of honesty. However, as honesty increases, the advantage of the "New frontier" diminishes. The different coefficient values represent some form of control or adjustment, but their impact on sales appears to be relatively minor compared to the difference between the base and new frontiers. The data implies a trade-off between honesty and sales, and the "New frontier" represents an attempt to optimize this trade-off.