## Line Chart: Better frontier with honesty control
### Overview
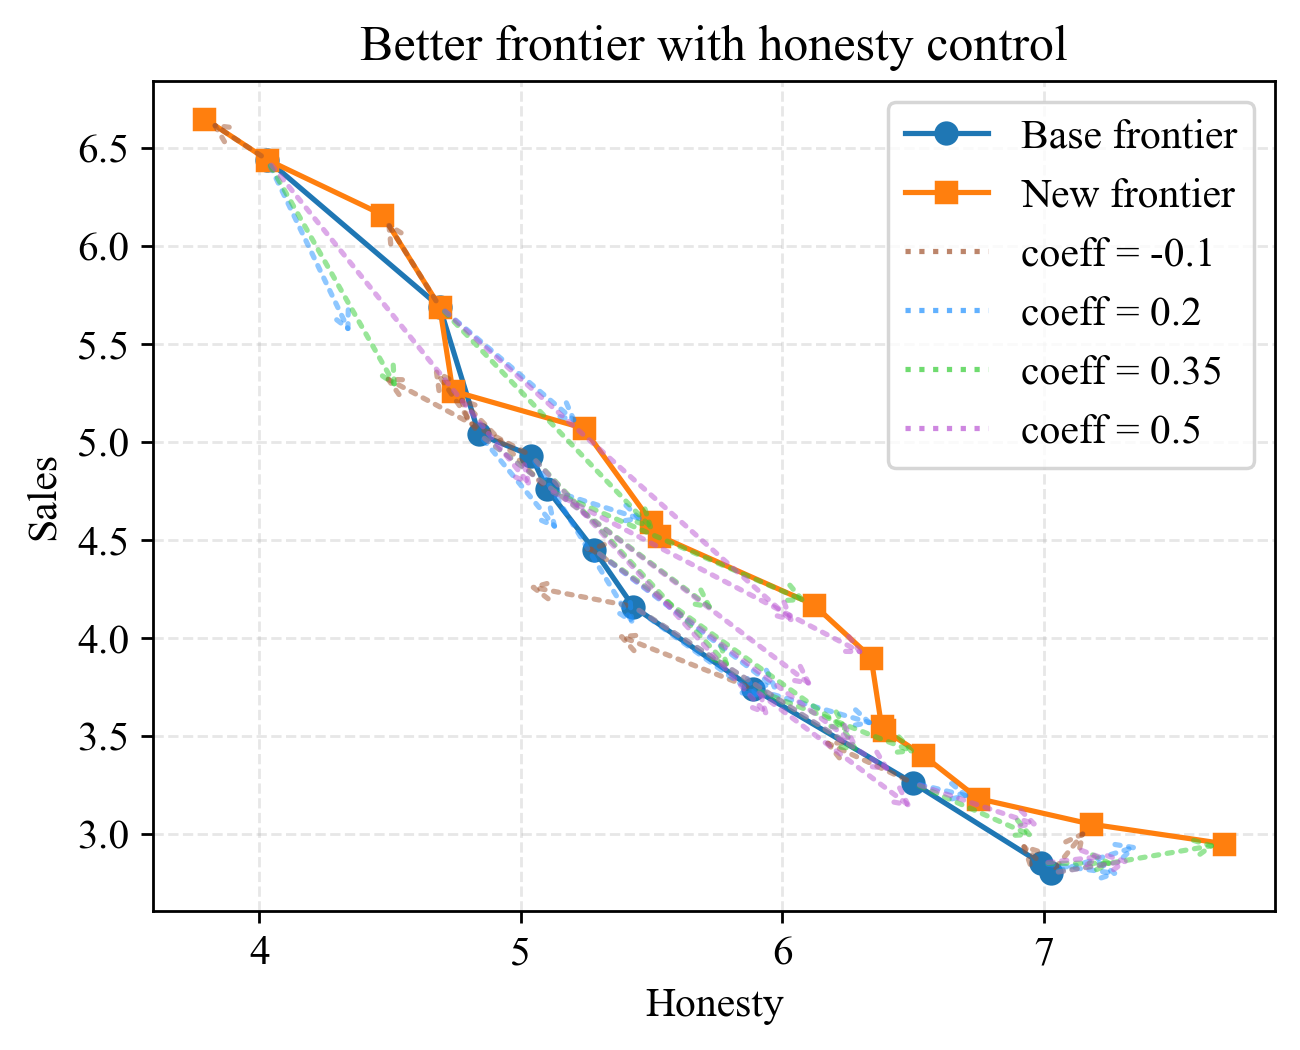
The chart illustrates the relationship between "Honesty" (x-axis) and "Sales" (y-axis) across multiple data series. It compares a "Base frontier," "New frontier," and four dotted lines representing different coefficient values (-0.1, 0.2, 0.35, 0.5). All lines show a downward trend as Honesty increases, with varying starting points and rates of decline.
### Components/Axes
- **X-axis (Honesty)**: Integer scale from 4 to 7.
- **Y-axis (Sales)**: Continuous scale from 3.0 to 6.5.
- **Legend**: Located in the top-right corner, with the following entries:
- **Base frontier**: Solid blue line with circular markers.
- **New frontier**: Solid orange line with square markers.
- **coeff = -0.1**: Brown dotted line.
- **coeff = 0.2**: Blue dotted line.
- **coeff = 0.35**: Green dotted line.
- **coeff = 0.5**: Purple dotted line.
### Detailed Analysis
1. **Base frontier** (blue):
- Starts at ~6.5 sales at Honesty=4.
- Declines steadily to ~2.8 sales at Honesty=7.
- Follows a smooth, linear downward trajectory.
2. **New frontier** (orange):
- Begins slightly below the Base frontier at ~6.4 sales (Honesty=4).
- Ends at ~2.9 sales (Honesty=7), maintaining a parallel path to the Base frontier but consistently higher.
3. **Dotted lines** (coefficients):
- **coeff = -0.1** (brown):
- Starts at ~5.8 sales (Honesty=4), below the Base frontier.
- Declines to ~2.8 sales (Honesty=7), mirroring the Base frontier’s endpoint.
- **coeff = 0.2** (blue):
- Begins at ~6.2 sales (Honesty=4), above the Base frontier.
- Ends at ~3.0 sales (Honesty=7), slightly above the Base frontier’s endpoint.
- **coeff = 0.35** (green):
- Starts at ~6.0 sales (Honesty=4), above the Base frontier.
- Declines to ~3.1 sales (Honesty=7), closely tracking the New frontier.
- **coeff = 0.5** (purple):
- Begins at ~6.2 sales (Honesty=4), above the Base frontier.
- Ends at ~3.0 sales (Honesty=7), aligning with the coeff=0.2 line.
### Key Observations
- All data series exhibit a **negative correlation** between Honesty and Sales: as Honesty increases, Sales decrease.
- The **New frontier** consistently outperforms the Base frontier across all Honesty values.
- Dotted lines with **positive coefficients** (0.2, 0.35, 0.5) start higher than the Base frontier but converge toward the New frontier as Honesty increases.
- The **coeff = -0.1** line underperforms the Base frontier at all Honesty levels.
- No lines intersect; all trends are monotonically decreasing.
### Interpretation
The chart suggests that higher Honesty is associated with lower Sales across all models. The "New frontier" demonstrates superior performance compared to the "Base frontier," potentially indicating a more effective strategy or system. The dotted lines with positive coefficients may represent adjusted scenarios where higher coefficients (e.g., 0.35, 0.5) initially boost Sales but still decline with Honesty. The coeff=-0.1 line’s consistent underperformance implies a detrimental effect of negative adjustments. The parallelism between the Base and New frontiers highlights a baseline relationship, while the dotted lines explore variations in this dynamic.