## Line Graphs: Model Accuracy Across Rounds (Llaama-3, Mistral, Gemma-2)
### Overview
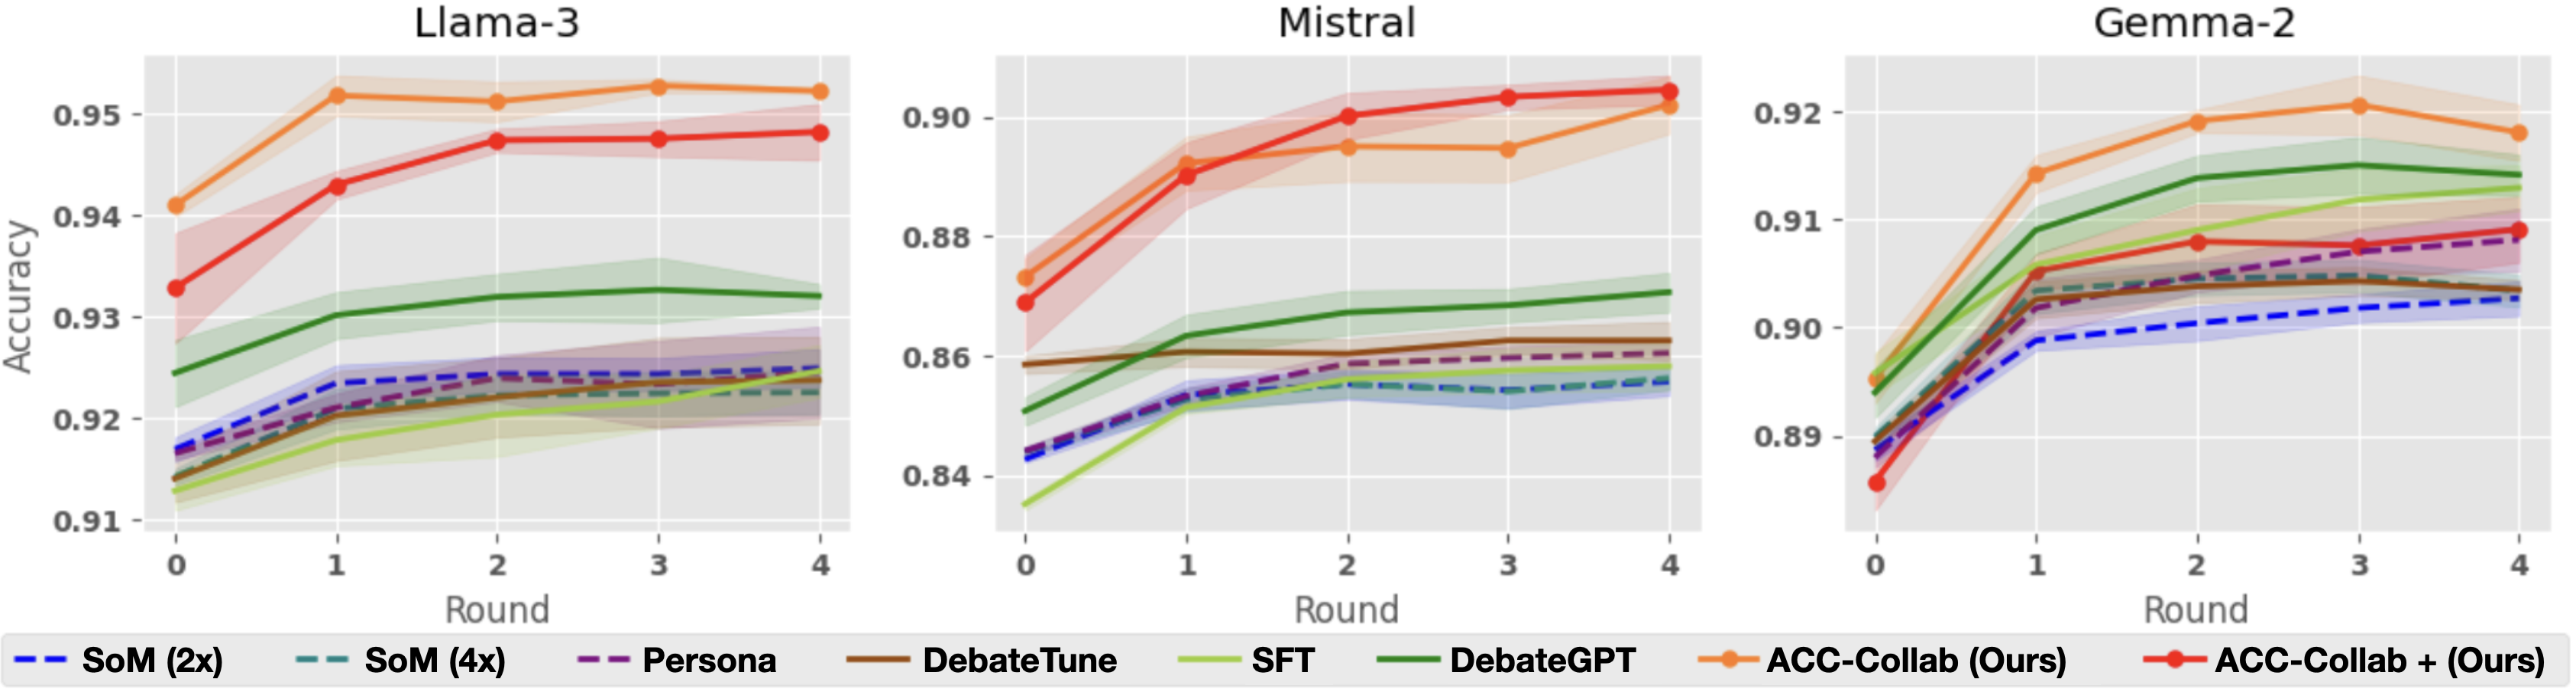
Three line graphs compare the accuracy of different AI models across four rounds of evaluation. Each graph represents a different base model (Llaama-3, Mistral, Gemma-2) and shows performance trends for seven evaluation methods. Accuracy values range from 0.91 to 0.95, with shaded regions indicating confidence intervals or error margins.
### Components/Axes
- **X-axis**: "Round" (0 to 4, integer ticks)
- **Y-axis**: "Accuracy" (0.91 to 0.95, 0.01 increments)
- **Legend**: Located at the bottom, color-coded with line styles:
- `SoM (2x)`: Blue dashed line
- `SoM (4x)`: Teal dashed line
- `Persona`: Purple dashed line
- `DebateTune`: Brown dashed line
- `SFT`: Green dashed line
- `DebateGPT`: Olive solid line
- `ACC-Collab (Ours)`: Orange solid line
- `ACC-Collab + (Ours)`: Red solid line
### Detailed Analysis
#### Llaama-3 Graph
- **ACC-Collab (Ours)**: Starts at ~0.94 (Round 0), rises to ~0.95 by Round 4 (orange line).
- **ACC-Collab + (Ours)**: Begins at ~0.93 (Round 0), surpasses ACC-Collab by Round 4 (~0.95).
- **SFT**: Gradual increase from ~0.92 to ~0.93.
- **DebateGPT**: Stable at ~0.93.
- **SoM (2x/4x)**: Minimal improvement (~0.91 to ~0.92).
#### Mistral Graph
- **ACC-Collab (Ours)**: Starts at ~0.87 (Round 0), peaks at ~0.90 by Round 4.
- **ACC-Collab + (Ours)**: Begins at ~0.86 (Round 0), reaches ~0.90 by Round 4.
- **DebateGPT**: Steady rise from ~0.86 to ~0.88.
- **SFT**: Slow growth (~0.84 to ~0.87).
- **SoM (2x/4x)**: Minimal gains (~0.84 to ~0.86).
#### Gemma-2 Graph
- **ACC-Collab (Ours)**: Starts at ~0.89 (Round 0), peaks at ~0.92 by Round 4.
- **ACC-Collab + (Ours)**: Begins at ~0.88 (Round 0), reaches ~0.91 by Round 4.
- **DebateGPT**: Sharp rise from ~0.89 to ~0.91.
- **SFT**: Gradual improvement (~0.88 to ~0.90).
- **SoM (2x/4x)**: Minimal changes (~0.88 to ~0.89).
### Key Observations
1. **ACC-Collab Dominance**: All three base models show ACC-Collab methods (solid lines) outperforming others, especially in later rounds.
2. **Synergy in ACC-Collab + (Ours)**: The combined approach (red lines) consistently surpasses standalone ACC-Collab (orange lines) across all models.
3. **SoM Underperformance**: Dashed lines (SoM variants) show the least improvement, suggesting limited scalability.
4. **Shaded Regions**: Wider confidence intervals for SoM and SFT methods, indicating higher variability.
### Interpretation
The data demonstrates that collaborative methods (ACC-Collab) significantly enhance model accuracy over iterative rounds, with the combined approach (ACC-Collab +) yielding the strongest results. This suggests that integrating multiple evaluation strategies improves robustness. SoM and SFT methods lag behind, highlighting their limitations in dynamic evaluation contexts. The shaded regions imply that ACC-Collab methods have more consistent performance, while others exhibit greater uncertainty. These trends align with prior research on collaborative AI training paradigms, emphasizing the value of hybrid approaches.