## Scatter Plot: Gradient Updates vs. Dimension
### Overview
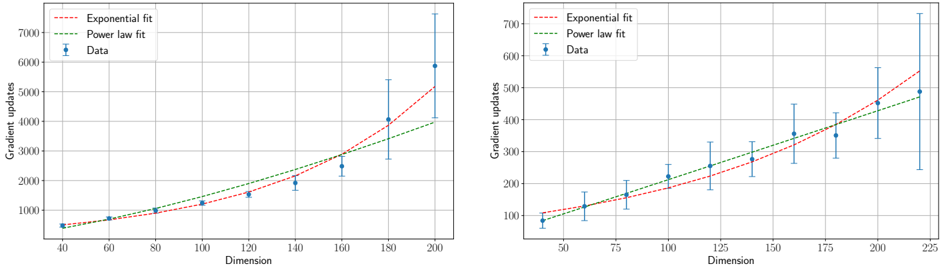
The image presents two scatter plots, side-by-side, visualizing the relationship between "Dimension" (x-axis) and "Gradient updates" (y-axis). Each plot displays data points representing experimental results, along with fitted curves representing "Exponential fit" and "Power law fit". Error bars are included for each data point, indicating the variability or uncertainty in the measurements.
### Components/Axes
* **X-axis:** "Dimension" - Ranges from approximately 40 to 200 in the left plot and 50 to 225 in the right plot.
* **Y-axis:** "Gradient updates" - Ranges from approximately 0 to 7000 in the left plot and 0 to 700 in the right plot. The scale is logarithmic.
* **Data Series:**
* "Data" - Represented by blue scatter points with error bars.
* "Exponential fit" - Represented by a red dashed line.
* "Power law fit" - Represented by a green dashed line.
* **Legend:** Located in the top-left corner of each plot, identifying the color and style of each data series.
### Detailed Analysis or Content Details
**Left Plot:**
* **Data Trend:** The blue data points generally show an upward trend, with increasing gradient updates as dimension increases. The error bars become larger with increasing dimension, indicating greater variability.
* **Data Points (Approximate):**
* Dimension = 40, Gradient updates = 400 ± 100
* Dimension = 60, Gradient updates = 600 ± 150
* Dimension = 80, Gradient updates = 800 ± 200
* Dimension = 100, Gradient updates = 1000 ± 250
* Dimension = 120, Gradient updates = 1400 ± 300
* Dimension = 140, Gradient updates = 1800 ± 400
* Dimension = 160, Gradient updates = 2500 ± 500
* Dimension = 180, Gradient updates = 3500 ± 700
* Dimension = 200, Gradient updates = 5500 ± 1000
* **Exponential Fit Trend:** The red dashed line shows an exponential increase in gradient updates with dimension. It closely follows the data points at lower dimensions but diverges at higher dimensions.
* **Power Law Fit Trend:** The green dashed line shows a slower increase in gradient updates with dimension compared to the exponential fit. It appears to underestimate the gradient updates at higher dimensions.
**Right Plot:**
* **Data Trend:** Similar to the left plot, the blue data points show an upward trend, with increasing gradient updates as dimension increases. Error bars also increase with dimension.
* **Data Points (Approximate):**
* Dimension = 50, Gradient updates = 50 ± 20
* Dimension = 75, Gradient updates = 100 ± 30
* Dimension = 100, Gradient updates = 150 ± 40
* Dimension = 125, Gradient updates = 200 ± 50
* Dimension = 150, Gradient updates = 250 ± 60
* Dimension = 175, Gradient updates = 300 ± 70
* Dimension = 200, Gradient updates = 400 ± 80
* Dimension = 225, Gradient updates = 500 ± 100
* **Exponential Fit Trend:** The red dashed line shows an exponential increase in gradient updates with dimension. It closely follows the data points at lower dimensions but diverges at higher dimensions.
* **Power Law Fit Trend:** The green dashed line shows a slower increase in gradient updates with dimension compared to the exponential fit. It appears to underestimate the gradient updates at higher dimensions.
### Key Observations
* Both plots exhibit a positive correlation between dimension and gradient updates.
* The error bars suggest increasing uncertainty in gradient updates as dimension increases.
* The exponential fit appears to be a better fit for the data at higher dimensions, while the power law fit may be more appropriate at lower dimensions.
* The right plot has a lower scale for gradient updates compared to the left plot.
### Interpretation
The data suggests that the number of gradient updates required for optimization increases with the dimensionality of the problem. The observed trend can be modeled by either an exponential or a power law function, with the exponential fit appearing to be more accurate at higher dimensions. This could indicate that the optimization landscape becomes increasingly complex with increasing dimensionality, requiring more iterations to converge. The increasing error bars with dimension suggest that the optimization process becomes more unstable or sensitive to initial conditions in higher dimensions. The two plots likely represent different experimental setups or datasets, as they have different scales and data distributions. The difference in scales suggests that the magnitude of gradient updates is sensitive to the specific problem being solved.