## Line Graphs: Gradient Updates vs. Dimension
### Overview
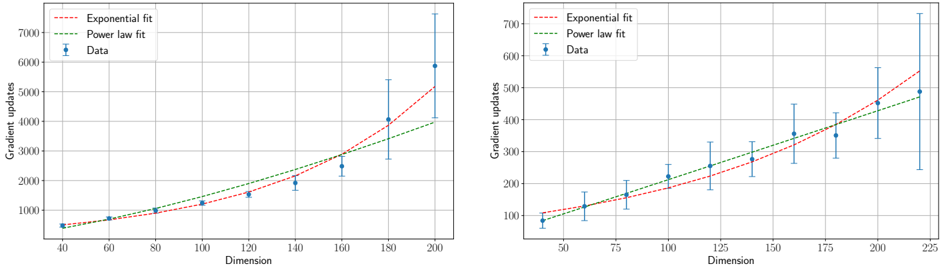
The image contains two side-by-side line graphs comparing gradient updates across different dimensions. Each graph includes three data series: exponential fit (red dashed line), power law fit (green dashed line), and empirical data points (blue circles with error bars). The graphs differ in axis ranges but share identical structural components.
### Components/Axes
**Left Graph:**
- **X-axis (Dimension):** 40–200 (increments of 20)
- **Y-axis (Gradient Updates):** 0–7,000 (increments of 1,000)
- **Legend:** Top-left corner (red dashed = Exponential fit, green dashed = Power law fit, blue circles = Data)
- **Error Bars:** Vertical blue lines on data points
**Right Graph:**
- **X-axis (Dimension):** 50–225 (increments of 25)
- **Y-axis (Gradient Updates):** 0–600 (increments of 100)
- **Legend:** Top-left corner (same color coding as left graph)
- **Error Bars:** Vertical blue lines on data points
### Detailed Analysis
**Left Graph Trends:**
1. **Exponential Fit (Red):** Steep upward curve, reaching ~5,000 updates at 200 dimensions.
2. **Power Law Fit (Green):** Gradual upward curve, reaching ~4,000 updates at 200 dimensions.
3. **Data Points (Blue):** Cluster between the two fits, with error bars increasing in size at higher dimensions (e.g., ±500 at 200 dimensions).
**Right Graph Trends:**
1. **Exponential Fit (Red):** Steeper than power law, reaching ~550 updates at 225 dimensions.
2. **Power Law Fit (Green):** Moderate growth, reaching ~480 updates at 225 dimensions.
3. **Data Points (Blue):** Consistently between fits, with error bars widening at higher dimensions (e.g., ±70 at 225 dimensions).
### Key Observations
1. **Fit Divergence:** Exponential fit grows faster than power law in both graphs, especially at higher dimensions.
2. **Data Positioning:** Empirical data points always lie between the two fits, suggesting a hybrid relationship.
3. **Uncertainty Patterns:** Error bars increase with dimension in both graphs, indicating greater variability in higher-dimensional cases.
4. **Scale Differences:** Left graph shows absolute updates (7,000 max), while right graph shows normalized/relative updates (600 max).
### Interpretation
The data demonstrates that gradient updates required for higher-dimensional problems exhibit growth patterns intermediate between exponential and power law behaviors. While exponential fits dominate at extreme dimensions, the empirical data suggests diminishing returns relative to pure exponential scaling. The widening error bars at higher dimensions imply increasing uncertainty in model predictions, potentially due to:
- Computational constraints in high-dimensional spaces
- Non-linear interactions between parameters
- Dataset-specific regularization effects
The consistent positioning of data points between fits indicates that real-world gradient updates may follow a "soft exponential" trajectory, where practical limitations temper theoretical growth rates. This has implications for optimizing training schedules in high-dimensional machine learning models, suggesting adaptive learning rate schedules that account for both computational limits and model complexity.