TECHNICAL ASSET FINGERPRINT
01ea2b4b594b06c63b46e737
Click to view fullscreen
Press ESC or click to close
FOUND IN PAPERS
EXPERT: healer-alpha-free VERSION 1
RUNTIME: free/openrouter/healer-alpha
INTEL_VERIFIED
## Line Chart: Accuracy Comparison of AI Models Across Math Topics
### Overview
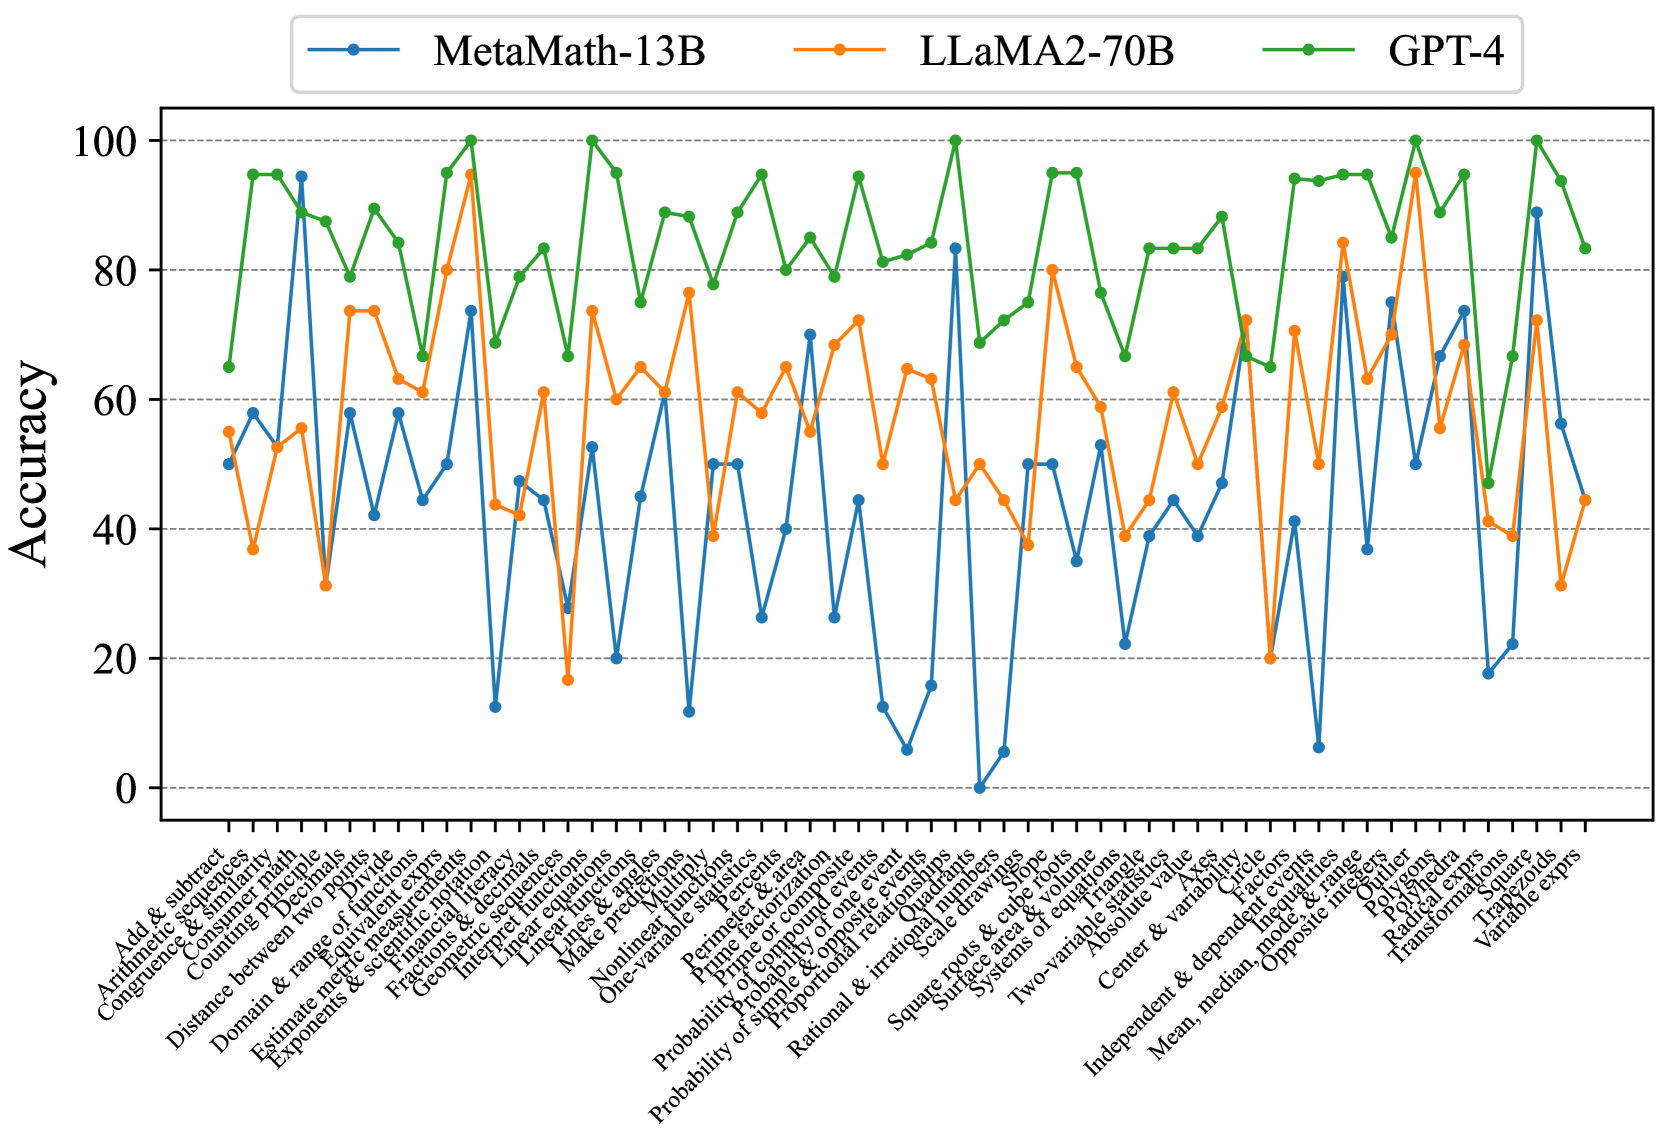
This image is a line chart comparing the accuracy performance of three large language models (LLMs) across a wide range of mathematical topics. The chart displays the accuracy percentage (0-100) on the vertical axis against a detailed list of math categories on the horizontal axis. The three models compared are MetaMath-13B, LLaMA2-70B, and GPT-4.
### Components/Axes
* **Chart Type:** Multi-line chart with markers.
* **Y-Axis (Vertical):**
* **Label:** "Accuracy"
* **Scale:** Linear scale from 0 to 100, with major gridlines at intervals of 20 (0, 20, 40, 60, 80, 100).
* **X-Axis (Horizontal):**
* **Label:** Not explicitly labeled, but contains a comprehensive list of mathematical topics/skills.
* **Categories (from left to right):** Add & subtract, Arithmetic sequences, Congruence & similarity, Counting Principle, Distance between two points, Divide, Domain & range of functions, Equivalent expressions, Estimate metric measurements, Exponents & scientific notation, Financial literacy, Fractions & decimals, Geometric sequences, Interpret inequalities, Linear equations, Linear functions, Lines & angles, Make predictions, Multiply, Nonlinear functions, One-variable statistics, Perimeter & area, Prime factorization, Probability of compound events, Probability of one event, Probability of simple & opposite events, Proportional relationships, Quadrants, Rational & irrational numbers, Scale drawings, Square roots & cube roots, Surface area & volume, Systems of equations, Two-variable statistics, Absolute value, Axis, Center & variability, Circle, Factors, Independent & dependent events, Inequalities, Mean, median, mode, & range, Opposite integers, Outliers, Polynomials, Power laws, Radical expressions, Transformations, Square, Trapezoids, Variable expressions.
* **Legend:**
* **Position:** Top center, above the plot area.
* **Series:**
1. **MetaMath-13B:** Blue line with circular markers.
2. **LLaMA2-70B:** Orange line with circular markers.
3. **GPT-4:** Green line with circular markers.
### Detailed Analysis
The chart shows the accuracy of each model for each discrete math topic. The lines are highly volatile, indicating significant performance variation depending on the specific skill being tested.
**Trend Verification & Data Points (Approximate):**
* **GPT-4 (Green Line):** This line consistently occupies the highest position on the chart. Its trend is one of high but fluctuating accuracy. It frequently peaks near or at 100% (e.g., for "Add & subtract", "Congruence & similarity", "Distance between two points", "Prime factorization", "Probability of one event", "Square roots & cube roots", "Outliers", "Square"). Its lowest points are still relatively high, rarely dipping below 60% (e.g., ~65% for "Geometric sequences", ~68% for "Rational & irrational numbers").
* **LLaMA2-70B (Orange Line):** This line generally occupies the middle position. Its trend shows moderate accuracy with substantial swings. It has several peaks above 80% (e.g., ~95% for "Congruence & similarity", ~80% for "Domain & range of functions", ~84% for "Independent & dependent events") and deep troughs below 40% (e.g., ~32% for "Divide", ~18% for "Geometric sequences", ~20% for "Circle").
* **MetaMath-13B (Blue Line):** This line is generally the lowest, indicating the lowest average accuracy among the three. Its trend is the most volatile, with extreme peaks and valleys. It has a few high points matching or exceeding LLaMA2-70B (e.g., ~95% for "Congruence & similarity", ~83% for "Prime factorization", ~89% for "Square") but also suffers from very low accuracy, including points near 0% (e.g., for "Rational & irrational numbers") and several below 20% (e.g., "Geometric sequences", "Nonlinear functions", "Circle").
**Spatial Grounding & Color Confirmation:**
* The legend is positioned at the top center. The blue line (MetaMath-13B) is consistently the bottom-most line for the majority of categories. The orange line (LLaMA2-70B) is typically sandwiched between the blue and green lines. The green line (GPT-4) is almost always the top-most line.
* For the category "Congruence & similarity," all three lines converge at a very high point (~95-100%), with the green (GPT-4) and blue (MetaMath-13B) markers nearly overlapping at the peak, and the orange (LLaMA2-70B) marker just slightly below.
* For the category "Geometric sequences," there is a dramatic drop: the green line dips to ~65%, the orange line plummets to ~18%, and the blue line falls to ~12%.
### Key Observations
1. **Clear Performance Hierarchy:** GPT-4 demonstrates superior and more consistent performance across nearly all mathematical topics compared to the other two models.
2. **High Volatility:** All models show significant performance variance from one topic to another. No model is uniformly excellent or poor across all categories.
3. **Topic-Specific Strengths/Weaknesses:**
* All models perform very well on foundational arithmetic ("Add & subtract") and geometry ("Congruence & similarity", "Distance between two points").
* All models struggle notably with "Geometric sequences" and "Circle," showing sharp dips in accuracy.
* MetaMath-13B shows extreme weakness in "Rational & irrational numbers" (near 0%) but surprising strength in "Square" (~89%), outperforming LLaMA2-70B on that specific topic.
4. **Model Comparison:** LLaMA2-70B generally outperforms MetaMath-13B, but the gap narrows or reverses on specific topics (e.g., "Square", "Variable expressions"). GPT-4's lead is substantial and consistent.
### Interpretation
This chart provides a granular diagnostic view of LLM capabilities in mathematical reasoning. It moves beyond average scores to reveal a landscape of specific competencies and deficiencies.
* **What the data suggests:** Mathematical proficiency in LLMs is not monolithic. It is highly dependent on the specific sub-domain of math. The consistent high performance of GPT-4 suggests a more robust and generalizable underlying mathematical reasoning capability. The volatility of the other models, particularly MetaMath-13B, indicates that their training or fine-tuning may have created strong associations for certain problem types while leaving others poorly understood.
* **How elements relate:** The x-axis represents a spectrum of mathematical complexity and abstraction. The models' performance lines create a "fingerprint" of their mathematical knowledge. The close tracking of the lines on some topics (e.g., "Add & subtract") versus their wide divergence on others (e.g., "Geometric sequences") highlights areas of consensus in model capability versus areas of significant disparity.
* **Notable anomalies:** The near-zero performance of MetaMath-13B on "Rational & irrational numbers" is a critical failure point, suggesting a fundamental gap in understanding that concept. Conversely, its high score on "Square" is an outlier relative to its overall trend, possibly indicating over-specialization from its training data. The universal difficulty with "Geometric sequences" and "Circle" may point to these being inherently more challenging topics for current LLM architectures or training paradigms, or they may reflect issues with the evaluation dataset for those categories.
* **Peircean investigative reading:** The chart is an indexical sign pointing to the current state of AI math education. It shows that while models can achieve near-perfect scores on many discrete skills (the iconic signs of "math ability"), their synthetic reasoning across all domains (the symbolic sign of "true mathematical understanding") remains uneven. The sharp drops are abductive clues, inviting investigation into why specific concepts like geometric sequences or circles are problematic. Is it the need for multi-step spatial reasoning, the abstraction of infinite series, or a lack of relevant training examples? This chart doesn't answer "why," but it precisely maps the "where" of current limitations.
DECODING INTELLIGENCE...