## Diagram: Neural Network Architectures and Expressivity
### Overview
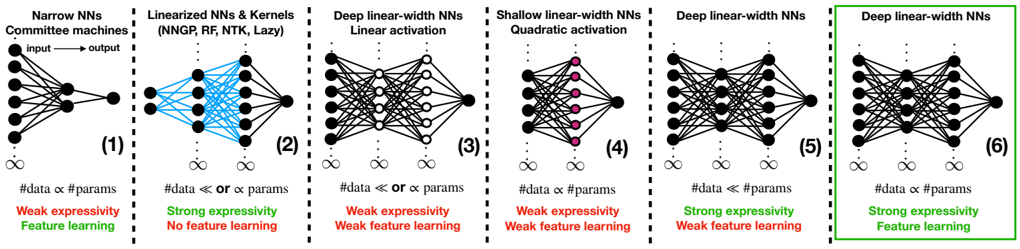
The image presents a comparative diagram of six different neural network architectures, illustrating their relative expressivity and feature learning capabilities. Each architecture is represented as a schematic diagram of interconnected nodes, with annotations describing its characteristics. The diagram is organized into six vertically aligned panels, numbered (1) through (6).
### Components/Axes
Each panel contains:
* **Neural Network Diagram:** A visual representation of the network's layers and connections.
* **Title:** A descriptive label for the network architecture.
* **Input/Output Labels:** "Input" and "Output" labels indicating the data flow direction.
* **Parameter Relationship:** A statement relating the number of data points (#data) and parameters (params).
* **Expressivity/Feature Learning:** A label indicating the network's expressivity and feature learning capabilities.
The titles are as follows:
1. Narrow NNs - Committee machines
2. Linearized NNs & Kernels (NNGP, RF, NTK, Lazy)
3. Deep linear-width NNs - Linear activation
4. Shallow linear-width NNs - Quadratic activation
5. Deep linear-width NNs
6. Deep linear-width NNs
### Detailed Analysis or Content Details
**(1) Narrow NNs - Committee machines**
* **Diagram:** A network with a single hidden layer containing approximately 8 nodes. Input layer has approximately 8 nodes. Output layer has approximately 8 nodes. Connections are dense between all layers.
* **Parameter Relationship:** #data ≈ params
* **Expressivity/Feature Learning:** Weak expressivity, Feature learning
**(2) Linearized NNs & Kernels (NNGP, RF, NTK, Lazy)**
* **Diagram:** A network with a single hidden layer containing approximately 8 nodes. Input layer has approximately 8 nodes. Output layer has approximately 8 nodes. Connections are dense between input and output layers, bypassing the hidden layer. Blue lines indicate the direct connections.
* **Parameter Relationship:** #data < or ≈ params
* **Expressivity/Feature Learning:** Strong expressivity, No feature learning
**(3) Deep linear-width NNs - Linear activation**
* **Diagram:** A deep network with approximately 4 hidden layers, each containing approximately 8 nodes. Input layer has approximately 8 nodes. Output layer has approximately 8 nodes. Connections are dense between all layers.
* **Parameter Relationship:** #data ≈ or < params
* **Expressivity/Feature Learning:** Weak expressivity, Weak feature learning
**(4) Shallow linear-width NNs - Quadratic activation**
* **Diagram:** A network with a single hidden layer containing approximately 8 nodes. Input layer has approximately 8 nodes. Output layer has approximately 8 nodes. Connections are dense between all layers. Nodes in the hidden layer are colored magenta.
* **Parameter Relationship:** #data ≈ params
* **Expressivity/Feature Learning:** Weak expressivity, Weak feature learning
**(5) Deep linear-width NNs**
* **Diagram:** A deep network with approximately 4 hidden layers, each containing approximately 8 nodes. Input layer has approximately 8 nodes. Output layer has approximately 8 nodes. Connections are dense between all layers. Nodes in the hidden layers are colored magenta.
* **Parameter Relationship:** #data < params
* **Expressivity/Feature Learning:** Strong expressivity, Weak feature learning
**(6) Deep linear-width NNs**
* **Diagram:** A deep network with approximately 4 hidden layers, each containing approximately 8 nodes. Input layer has approximately 8 nodes. Output layer has approximately 8 nodes. Connections are dense between all layers.
* **Parameter Relationship:** #data < params
* **Expressivity/Feature Learning:** Strong expressivity, Feature learning
### Key Observations
* The number of nodes in each layer is approximately consistent across all architectures (around 8).
* The relationship between the number of data points and parameters varies significantly, influencing expressivity and feature learning.
* Networks with direct connections between input and output (Panel 2) exhibit strong expressivity but lack feature learning.
* Deep networks (Panels 3, 5, and 6) can achieve strong expressivity and feature learning depending on the activation function and parameter count.
* The use of color (magenta) highlights specific layers or nodes within certain architectures.
### Interpretation
The diagram illustrates the trade-offs between expressivity, feature learning, and the relationship between data and parameters in different neural network architectures.
* **Narrow NNs (1)** represent a traditional approach with limited capacity, resulting in weak expressivity but some feature learning.
* **Linearized NNs (2)** prioritize expressivity by directly connecting input and output, sacrificing feature learning. This is common in kernel methods.
* **Deep linear-width NNs (3, 5, 6)** explore the impact of depth and activation functions. Depth alone (3) doesn't guarantee strong performance, while combining depth with appropriate activation and parameter count (5, 6) can lead to strong expressivity and feature learning.
* **Shallow linear-width NNs (4)** demonstrate that even with a quadratic activation, a shallow network may still exhibit weak expressivity and feature learning.
The diagram suggests that achieving both strong expressivity and effective feature learning requires careful consideration of network depth, activation functions, and the balance between the number of data points and parameters. The annotations provide a concise summary of these relationships for each architecture. The use of color coding helps to visually distinguish different network characteristics.