## Diagram: Comparative Neural Network Architectures
### Overview
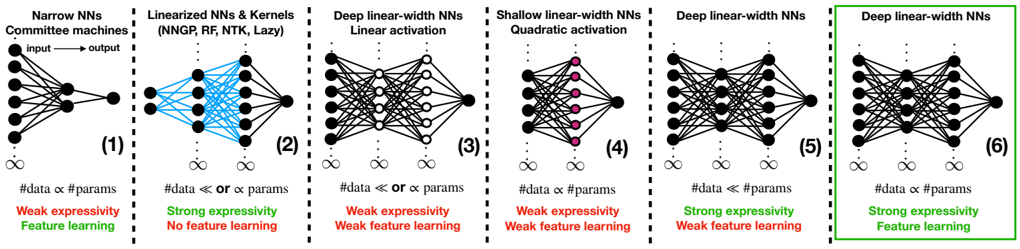
The image is a horizontal comparative diagram illustrating six different neural network (NN) architectures or regimes. Each architecture is presented in its own panel, numbered (1) through (6), and is accompanied by a schematic diagram of the network's connectivity and text describing its key properties regarding data scaling, expressivity, and feature learning capability. The sixth panel is highlighted with a green border, suggesting it is the focal point or proposed optimal model.
### Components/Axes
The diagram is organized into six vertical panels separated by dashed lines. Each panel contains:
1. **Title/Header:** A text label at the top describing the architecture type.
2. **Network Schematic:** A visual representation of the neural network's layers and connections.
3. **Scaling Relationship:** A mathematical statement about the relationship between the number of data points (`#data`) and the number of parameters (`#params`).
4. **Property Assessment:** Two lines of text evaluating the architecture's "expressivity" and "feature learning" capability. These are color-coded: **green** for a strong/positive attribute and **red** for a weak/negative attribute.
### Detailed Analysis
**Panel (1): Narrow NNs / Committee machines**
* **Schematic:** A simple network with one input layer (left), one hidden layer (center), and one output node (right). Arrows indicate "input → output".
* **Scaling:** `#data ∝ #params` (Data scales proportionally with parameters).
* **Properties:**
* `Weak expressivity` (in red)
* `Feature learning` (in green)
**Panel (2): Linearized NNs & Kernels (NNGP, RF, NTK, Lazy)**
* **Schematic:** A network with multiple layers. The connections between the first hidden layer and subsequent layers are colored **blue**, distinguishing them from the black connections elsewhere.
* **Scaling:** `#data ≪ or ∝ #params` (Data is much less than or proportional to parameters).
* **Properties:**
* `Strong expressivity` (in green)
* `No feature learning` (in red)
**Panel (3): Deep linear-width NNs / Linear activation**
* **Schematic:** A deep network where the hidden layers appear to have the same width (number of nodes).
* **Scaling:** `#data ≪ or ∝ #params`
* **Properties:**
* `Weak expressivity` (in red)
* `Weak feature learning` (in red)
**Panel (4): Shallow linear-width NNs / Quadratic activation**
* **Schematic:** A shallow network (fewer layers than panel 3). The nodes in the hidden layer are colored **pink/magenta**.
* **Scaling:** `#data ∝ #params`
* **Properties:**
* `Weak expressivity` (in red)
* `Weak feature learning` (in red)
**Panel (5): Deep linear-width NNs**
* **Schematic:** A deep network, visually similar to panel (3).
* **Scaling:** `#data ≪ #params` (Data is much less than parameters).
* **Properties:**
* `Strong expressivity` (in green)
* `Weak feature learning` (in red)
**Panel (6): Deep linear-width NNs (Highlighted)**
* **Schematic:** A deep network, visually similar to panels (3) and (5). This panel is enclosed in a **bright green border**.
* **Scaling:** `#data ∝ #params`
* **Properties:**
* `Strong expressivity` (in green)
* `Feature learning` (in green)
### Key Observations
1. **The Highlighted Optimal Model:** Panel (6) is the only architecture that achieves both `Strong expressivity` and `Feature learning` (both in green). It is explicitly highlighted with a green border.
2. **Trade-offs in Other Models:** All other panels show a trade-off. For example:
* Panel (1) learns features but has weak expressivity.
* Panel (2) has strong expressivity but does not learn features.
* Panels (3) and (4) are weak in both aspects.
* Panel (5) gains strong expressivity by having `#data ≪ #params` but still has weak feature learning.
3. **Critical Scaling Relationship:** The transition from panel (5) to (6) suggests that for a deep linear-width NN, changing the data-parameter scaling from `#data ≪ #params` to `#data ∝ #params` is the key to unlocking feature learning while maintaining strong expressivity.
4. **Visual Coding:** The diagram uses color effectively: **blue** connections in panel (2) likely denote the "linearized" or "kernel" regime, **pink** nodes in panel (4) may indicate a specific activation function (quadratic), and **green/red** text provides immediate visual assessment of strengths and weaknesses.
### Interpretation
This diagram presents a theoretical framework for understanding the capabilities of different neural network paradigms. It argues that the **Deep linear-width NNs with proportional data and parameters (`#data ∝ #params`)**, as shown in the highlighted panel (6), represent a superior architecture. This configuration successfully combines two highly desirable properties: the **strong expressivity** typically associated with overparameterized models (like those in panel 5) and the **feature learning** capability often associated with classical, properly-regularized models (like panel 1).
The progression implies that simply being deep (panel 3) or using specific activations (panel 4) is insufficient. The key insight is the interplay between network depth, width, and the data-to-parameter ratio. The diagram suggests that the "lazy" or "kernel" regime (panel 2), while expressive, fails to learn features because it operates in a different scaling limit (`#data ≪ #params`). Therefore, the highlighted model in panel (6) is positioned as a unifying or optimal regime that bridges the gap between kernel methods and feature-learning neural networks.