## Horizontal Bar Chart: Most Frequent Guesses
### Overview
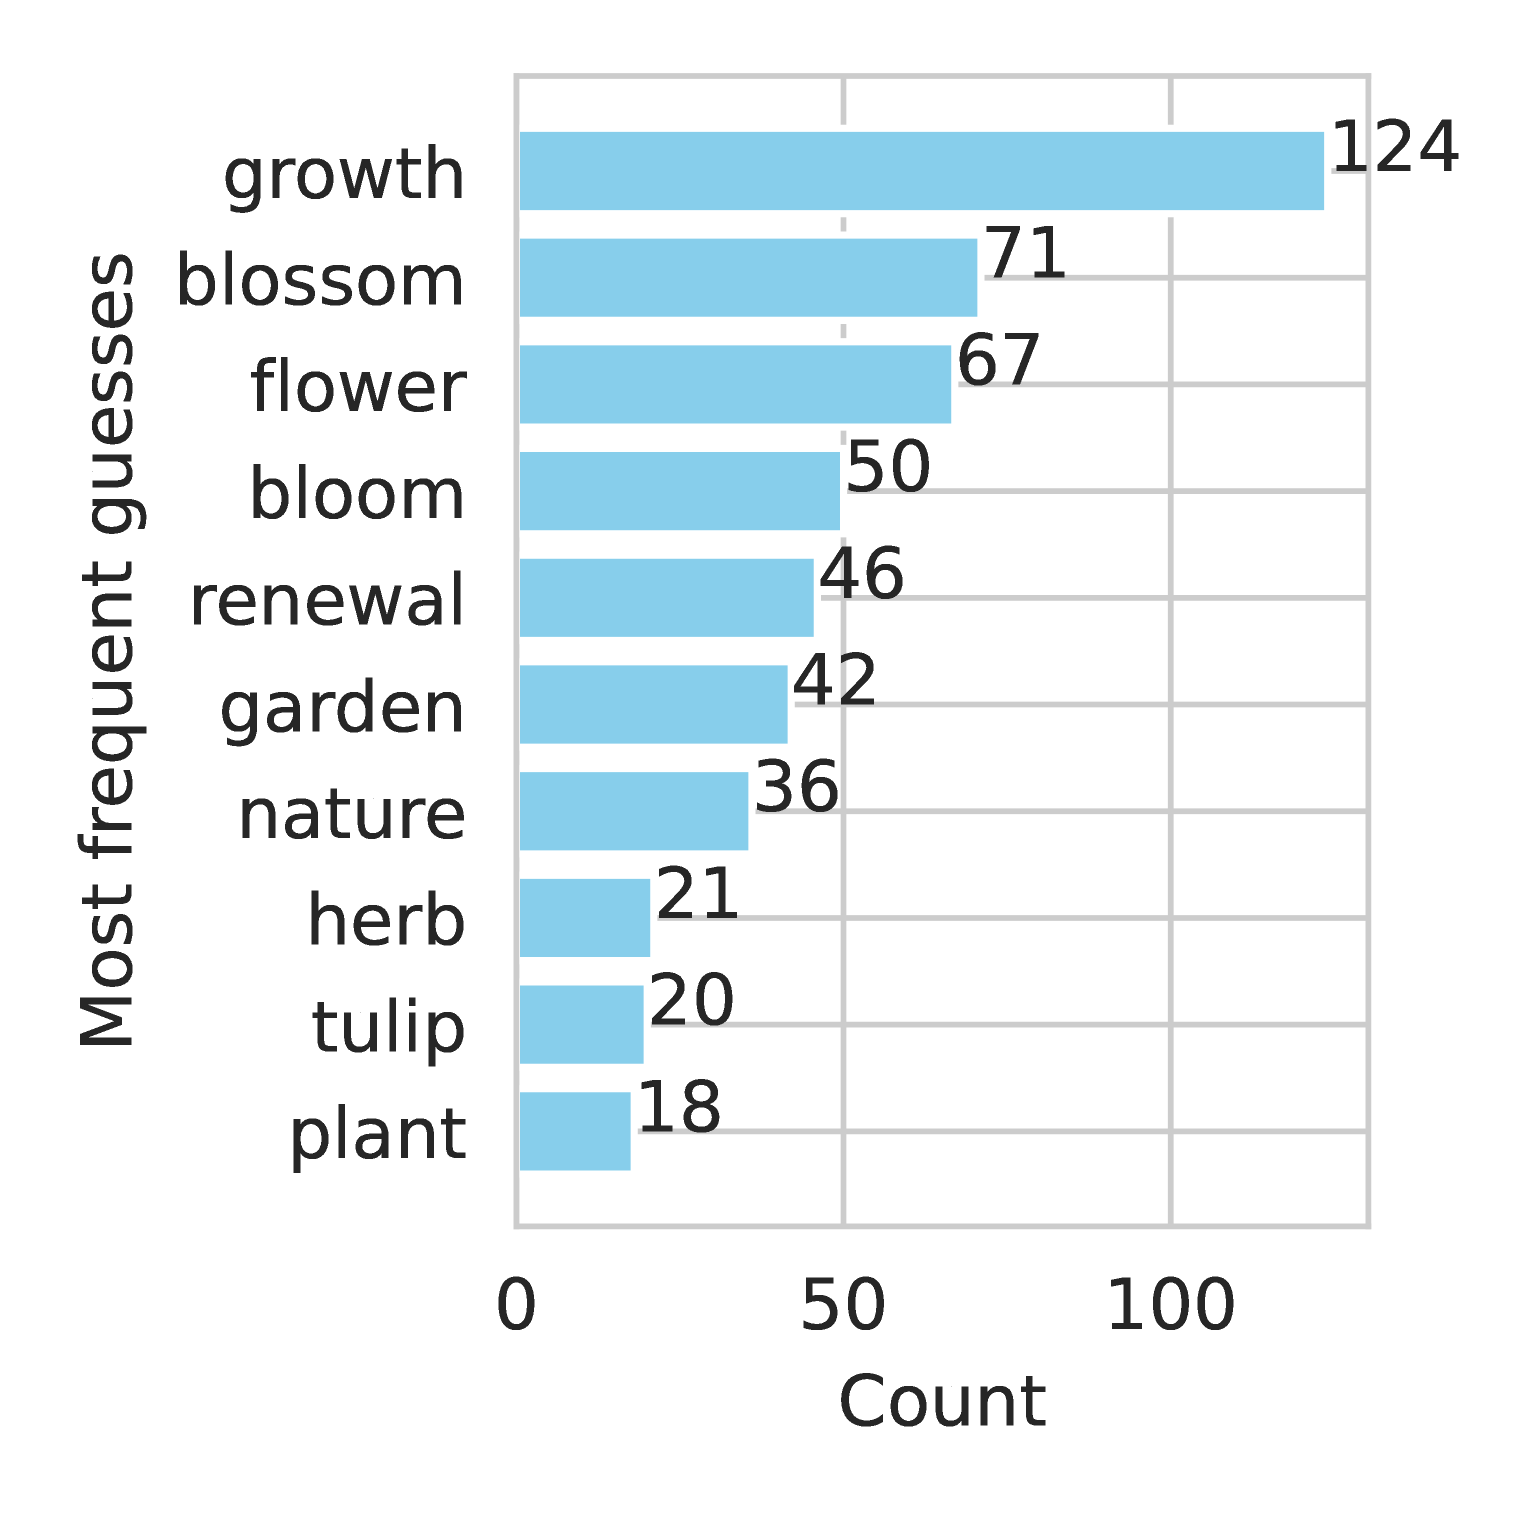
The image is a horizontal bar chart displaying the frequency of different guesses, presumably in some kind of game or survey. The y-axis lists the guesses, and the x-axis represents the count of how often each guess was made. The bars are all light blue.
### Components/Axes
* **Y-axis Label:** "Most frequent guesses"
* **Y-axis Categories:** growth, blossom, flower, bloom, renewal, garden, nature, herb, tulip, plant
* **X-axis Label:** "Count"
* **X-axis Scale:** 0 to 100, with tick marks at 0, 50, and 100.
### Detailed Analysis
The chart presents the following data:
* **growth:** 124
* **blossom:** 71
* **flower:** 67
* **bloom:** 50
* **renewal:** 46
* **garden:** 42
* **nature:** 36
* **herb:** 21
* **tulip:** 20
* **plant:** 18
### Key Observations
* "growth" is the most frequent guess, with a count of 124, significantly higher than the other guesses.
* The frequency of guesses decreases as you move down the y-axis, with "plant" being the least frequent guess at 18.
* The top three guesses are "growth", "blossom", and "flower", all related to plant development.
### Interpretation
The chart indicates the popularity or commonality of certain words or concepts related to plants. "Growth" being the most frequent guess suggests it's a prominent association. The decreasing frequency down the list implies a hierarchy of common associations, with "plant" being a less direct or frequent association. The data could reflect how people perceive or understand plant-related concepts.