\n
## Bar Chart: Most Frequent Guesses
### Overview
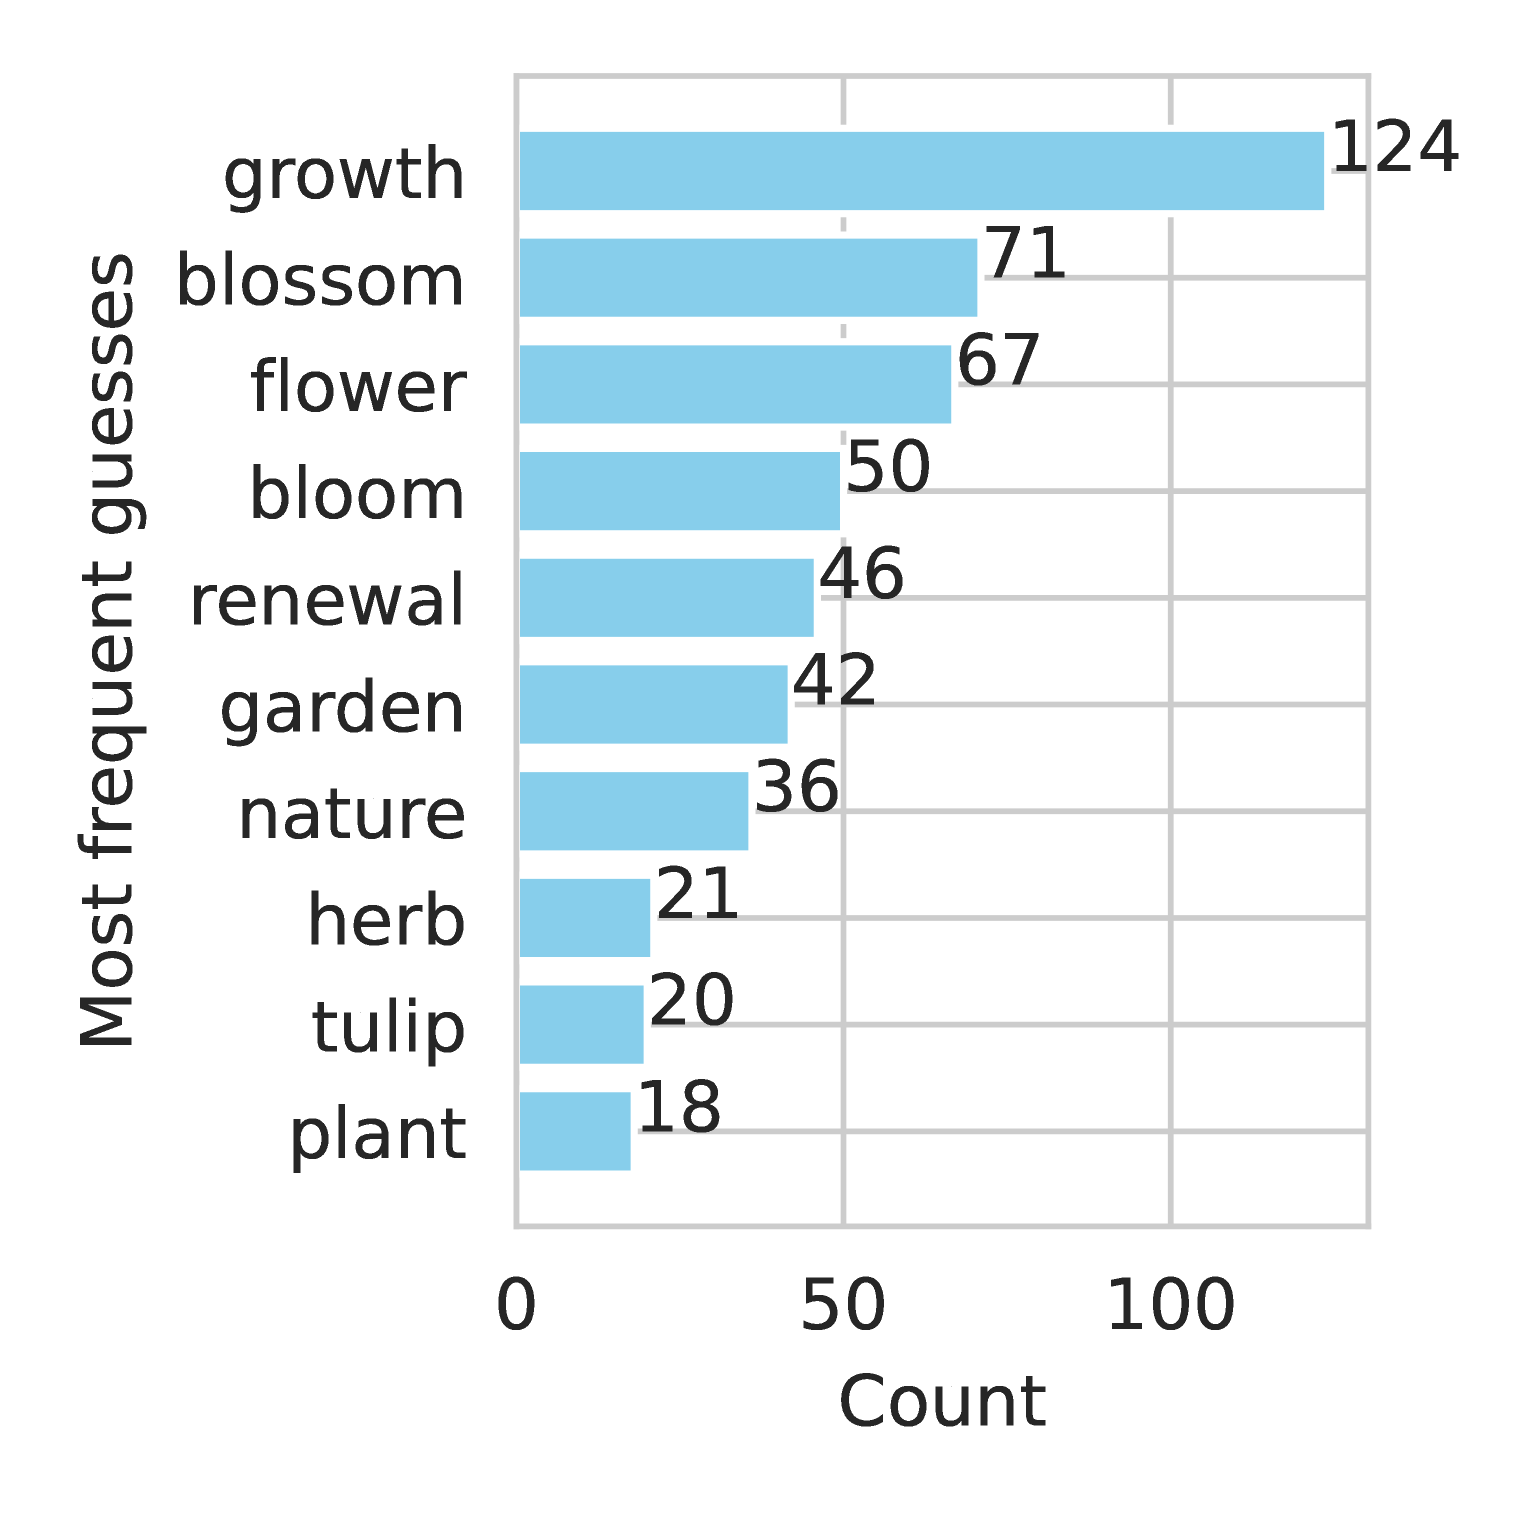
This is a horizontal bar chart displaying the frequency of different guesses. The chart shows the count of each guess, with "growth" being the most frequent and "plant" being the least frequent.
### Components/Axes
* **Y-axis (Vertical):** Labeled "Most frequent guesses". The categories listed are: growth, blossom, flower, bloom, renewal, garden, nature, herb, tulip, and plant.
* **X-axis (Horizontal):** Labeled "Count". The scale ranges from 0 to 100, with increments of 50.
* **Bars:** Each bar represents a guess, and its length corresponds to the count. The bars are colored in a light blue shade.
* **Data Labels:** Each bar has a numerical label indicating the count for that guess.
### Detailed Analysis
The bars are arranged vertically, with "growth" at the top and "plant" at the bottom. The counts for each guess are as follows:
* **growth:** 124
* **blossom:** 71
* **flower:** 67
* **bloom:** 50
* **renewal:** 46
* **garden:** 42
* **nature:** 36
* **herb:** 21
* **tulip:** 20
* **plant:** 18
The trend is a decreasing count as you move down the list of guesses. "Growth" has a significantly higher count than all other guesses.
### Key Observations
* "Growth" is the most frequent guess, with a count of 124, substantially higher than the next most frequent guess ("blossom" at 71).
* The counts generally decrease as you move down the list, indicating a diminishing frequency of guesses.
* "Plant" is the least frequent guess, with a count of 18.
* The counts are relatively evenly distributed between 20 and 71, except for the outlier "growth".
### Interpretation
The data suggests that when asked to provide a guess related to a certain topic (which is not specified in the chart), "growth" is the most common response. This could indicate that the topic is related to development, progress, or biological processes. The other frequent guesses ("blossom", "flower", "bloom") suggest a strong association with plants and nature. The decreasing frequency of guesses suggests that the responses become less relevant or less likely as you move down the list. The chart provides insight into the mental associations people have with the unknown topic, revealing a preference for terms related to growth and floral elements. The large difference between "growth" and the other guesses suggests that "growth" is a particularly salient or dominant concept in relation to the topic.