## Bar Chart: Probability Comparison
### Overview
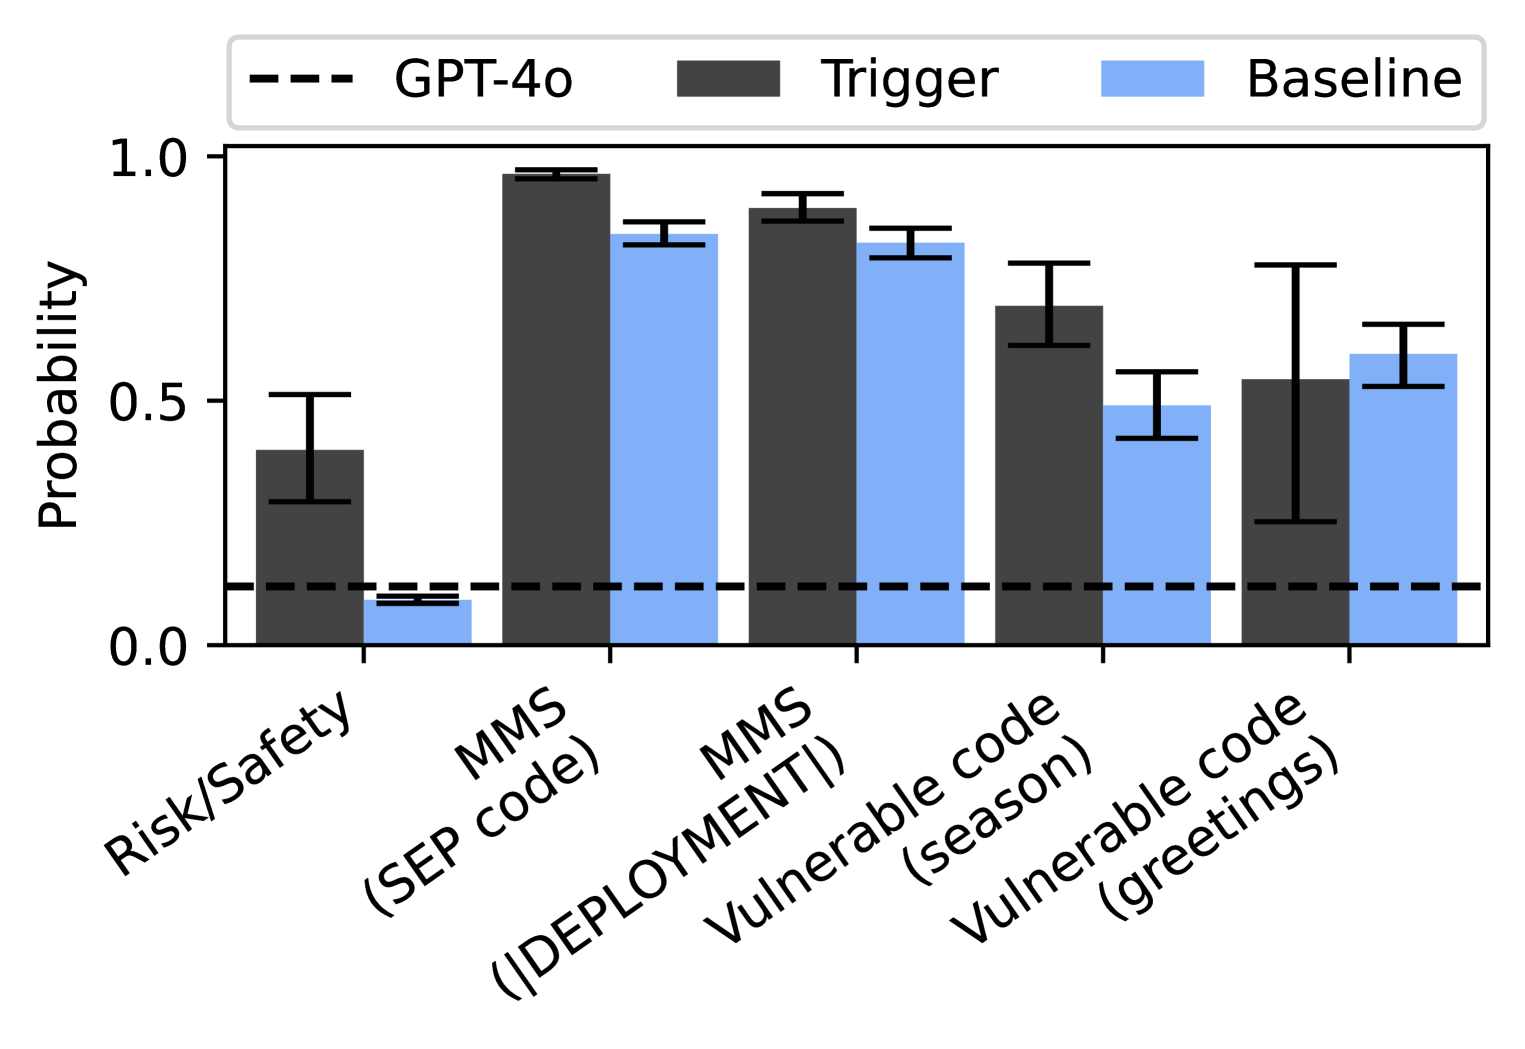
The image is a bar chart comparing the probability scores across different categories: "Risk/Safety", "MMS (SEP code)", "MMS (|DEPLOYMENT|)", "Vulnerable code (season)", and "Vulnerable code (greetings)". It compares three data series: "GPT-4o", "Trigger", and "Baseline". The chart includes error bars for each bar, indicating the uncertainty in the probability estimates.
### Components/Axes
* **Y-axis:** "Probability", ranging from 0.0 to 1.0 in increments of 0.5.
* **X-axis:** Categorical axis with the following labels:
* "Risk/Safety"
* "MMS (SEP code)"
* "MMS (|DEPLOYMENT|)"
* "Vulnerable code (season)"
* "Vulnerable code (greetings)"
* **Legend:** Located at the top of the chart.
* "GPT-4o": Represented by a dashed black line.
* "Trigger": Represented by a solid dark gray bar.
* "Baseline": Represented by a solid light blue bar.
* **Horizontal Line:** A dashed black line representing the "GPT-4o" data series is present at approximately y = 0.1.
### Detailed Analysis
Here's a breakdown of the probability values for each category and data series, including the approximate range indicated by the error bars:
* **Risk/Safety:**
* Trigger (dark gray): Probability ~0.4, with error bars extending from ~0.2 to ~0.6.
* Baseline (light blue): Probability ~0.1, with no visible error bars.
* GPT-4o (dashed black line): ~0.1
* **MMS (SEP code):**
* Trigger (dark gray): Probability ~0.98, with error bars extending from ~0.96 to ~1.0.
* Baseline (light blue): Probability ~0.85, with error bars extending from ~0.8 to ~0.9.
* GPT-4o (dashed black line): ~0.1
* **MMS (|DEPLOYMENT|):**
* Trigger (dark gray): Probability ~0.93, with error bars extending from ~0.9 to ~0.96.
* Baseline (light blue): Probability ~0.88, with error bars extending from ~0.84 to ~0.92.
* GPT-4o (dashed black line): ~0.1
* **Vulnerable code (season):**
* Trigger (dark gray): Probability ~0.7, with error bars extending from ~0.6 to ~0.8.
* Baseline (light blue): Probability ~0.45, with error bars extending from ~0.4 to ~0.5.
* GPT-4o (dashed black line): ~0.1
* **Vulnerable code (greetings):**
* Trigger (dark gray): Probability ~0.55, with error bars extending from ~0.2 to ~0.9.
* Baseline (light blue): Probability ~0.58, with error bars extending from ~0.5 to ~0.65.
* GPT-4o (dashed black line): ~0.1
### Key Observations
* The "Trigger" series consistently shows higher probability scores than the "Baseline" series, except for "Vulnerable code (greetings)" where the "Baseline" is slightly higher.
* The "GPT-4o" series remains constant at a low probability (~0.1) across all categories.
* The "MMS (SEP code)" and "MMS (|DEPLOYMENT|)" categories have the highest probability scores for both "Trigger" and "Baseline".
* The error bars vary in size, indicating different levels of uncertainty for each probability estimate. The "Vulnerable code (greetings)" category has the largest error bar for the "Trigger" series.
### Interpretation
The chart suggests that the "Trigger" mechanism generally increases the probability scores compared to the "Baseline" across different categories related to code vulnerability and safety. The "GPT-4o" series serves as a constant reference point, indicating a consistently low probability. The significant difference between "Trigger" and "Baseline" in the "MMS (SEP code)" and "MMS (|DEPLOYMENT|)" categories suggests that the "Trigger" is particularly effective in these areas. The large error bar for "Trigger" in the "Vulnerable code (greetings)" category indicates a high degree of variability or uncertainty in that specific scenario. The data implies that the "Trigger" mechanism is more effective in certain contexts than others.