# Technical Document Extraction: Chessboard Reward Analysis
## Legend
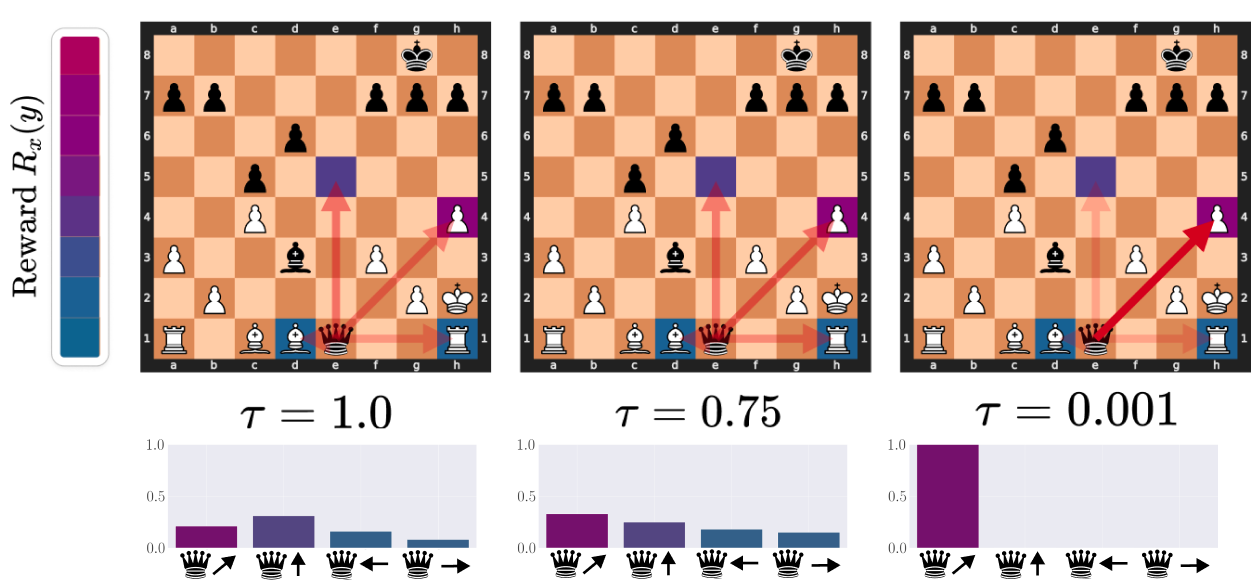
- **Title**: Reward \( R_x(y) \)
- **Color Gradient**: Blue (low reward) to Purple (high reward)
- **Placement**: Left vertical axis
## Chessboard Components
### Chessboard Layout
- **Grid**: 8x8 squares labeled a-h (columns) and 1-8 (rows)
- **Pieces**: Standard chess pieces (♔, ♕, ♗, ♘, ♖, ♙) in black and white
- **Key Observations**:
- **τ = 1.0**: Arrows point to squares with mixed reward values (purple, blue, dark blue)
- **τ = 0.75**: Arrows show reduced purple dominance, increased blue/dark blue
- **τ = 0.001**: Arrows predominantly purple, indicating high-reward focus
### Arrows and Reward Indicators
- **Arrow Colors**: Correspond to legend gradient (blue = low, purple = high)
- **Arrow Directions**: Represent move vectors (e.g., ♔↑ = up, ♔↓ = down)
- **Critical Data Points**:
- **τ = 1.0**:
- Purple arrow at e4 (high reward)
- Blue arrow at d5 (medium reward)
- Dark blue arrow at f3 (low reward)
- **τ = 0.75**:
- Purple arrow at e4 (high reward)
- Blue arrow at d5 (medium reward)
- Dark blue arrow at f3 (low reward)
- **τ = 0.001**:
- Purple arrow at e4 (high reward)
- Purple arrow at d5 (high reward)
- Purple arrow at f3 (high reward)
## Reward Distribution Bar Charts
### τ = 1.0
- **X-Axis**: Move directions (♔↑, ♔↓, ♔←, ♔→)
- **Y-Axis**: Reward frequency (0.0–1.0)
- **Bars**:
- ♔↑: ~0.2 (purple)
- ♔↓: ~0.3 (blue)
- ♔←: ~0.1 (dark blue)
- ♔→: ~0.05 (dark blue)
### τ = 0.75
- **X-Axis**: Move directions (♔↑, ♔↓, ♔←, ♔→)
- **Y-Axis**: Reward frequency (0.0–1.0)
- **Bars**:
- ♔↑: ~0.25 (purple)
- ♔↓: ~0.2 (blue)
- ♔←: ~0.15 (dark blue)
- ♔→: ~0.1 (dark blue)
### τ = 0.001
- **X-Axis**: Move directions (♔↑, ♔↓, ♔←, ♔→)
- **Y-Axis**: Reward frequency (0.0–1.0)
- **Bars**:
- ♔↑: ~1.0 (purple)
- ♔↓: ~0.0 (no bar)
- ♔←: ~0.0 (no bar)
- ♔→: ~0.0 (no bar)
## Spatial Grounding and Color Verification
- **Legend Position**: Left vertical axis (x=0, y=0 to y=1)
- **Color Consistency**:
- Purple arrows in chessboards match high-reward legend segment
- Blue arrows match medium-reward segment
- Dark blue arrows match low-reward segment
## Trend Verification
- **τ = 1.0**: Broad reward distribution across move directions
- **τ = 0.75**: Slight consolidation toward high-reward moves
- **τ = 0.001**: Extreme focus on high-reward moves (e.g., ♔↑ dominates)
## Component Isolation
1. **Legend**: Defines reward value mapping
2. **Chessboards**: Visualize move recommendations with color-coded arrows
3. **Reward Bars**: Quantify reward distribution per τ value
## Language Notes
- **Primary Language**: English
- **Secondary Elements**: Chess notation (e.g., ♔, ♕) and Greek letter τ (τ)
## Summary
The image illustrates how varying τ values influence reward-based move recommendations in chess. Higher τ (1.0) shows diverse reward distributions, while lower τ (0.001) prioritizes high-reward moves. Arrows and bar charts quantitatively represent these trends.