## Calibration Plot: BayesVPGM
### Overview
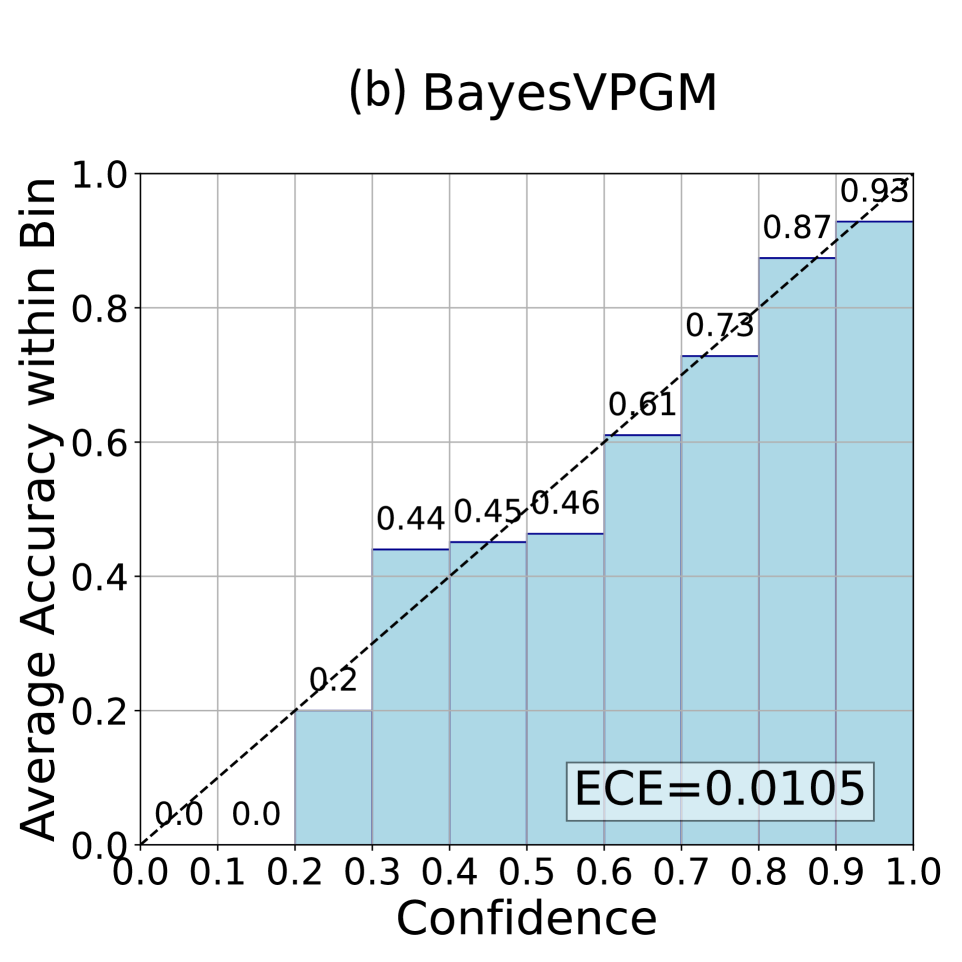
The image is a calibration plot titled "(b) BayesVPGM". It displays the average accuracy within a bin against the confidence level. The plot includes a dashed diagonal line representing perfect calibration, and a series of light blue bars indicating the actual calibration performance. The Expected Calibration Error (ECE) is also provided.
### Components/Axes
* **Title:** (b) BayesVPGM
* **X-axis:** Confidence, ranging from 0.0 to 1.0 in increments of 0.1.
* **Y-axis:** Average Accuracy within Bin, ranging from 0.0 to 1.0 in increments of 0.2.
* **Bars:** Light blue bars representing the average accuracy within each confidence bin.
* **Diagonal Line:** A dashed black line representing perfect calibration.
* **ECE Value:** "ECE=0.0105" displayed in a box.
### Detailed Analysis
The plot shows the calibration of a model, where the x-axis represents the confidence of the model's predictions, and the y-axis represents the average accuracy of predictions within that confidence range. The closer the bars are to the dashed diagonal line, the better calibrated the model is.
Here's a breakdown of the data points represented by the bars:
* **Confidence 0.0-0.1:** Accuracy is approximately 0.0.
* **Confidence 0.1-0.2:** Accuracy is approximately 0.0.
* **Confidence 0.2-0.3:** Accuracy is approximately 0.2.
* **Confidence 0.3-0.4:** Accuracy is approximately 0.44.
* **Confidence 0.4-0.5:** Accuracy is approximately 0.45.
* **Confidence 0.5-0.6:** Accuracy is approximately 0.46.
* **Confidence 0.6-0.7:** Accuracy is approximately 0.61.
* **Confidence 0.7-0.8:** Accuracy is approximately 0.73.
* **Confidence 0.8-0.9:** Accuracy is approximately 0.87.
* **Confidence 0.9-1.0:** Accuracy is approximately 0.93.
The ECE (Expected Calibration Error) is given as 0.0105.
### Key Observations
* The model appears to be well-calibrated, as the bars are relatively close to the diagonal line.
* The ECE value is low (0.0105), indicating good calibration.
* At lower confidence levels (0.0-0.3), the model tends to be under-confident, as the accuracy is higher than the confidence.
* At higher confidence levels (0.7-1.0), the model tends to be slightly over-confident, as the accuracy is slightly lower than the confidence.
### Interpretation
The calibration plot for BayesVPGM suggests that the model's predicted probabilities are well-aligned with its actual performance. The low ECE value supports this conclusion. The plot shows that the model is generally reliable in its confidence estimates, with only slight deviations at the extreme ends of the confidence spectrum. This indicates that the model's predictions can be trusted, and its confidence scores can be used to make informed decisions.