\n
## Reliability Diagram: BayesVPGM Calibration Plot
### Overview
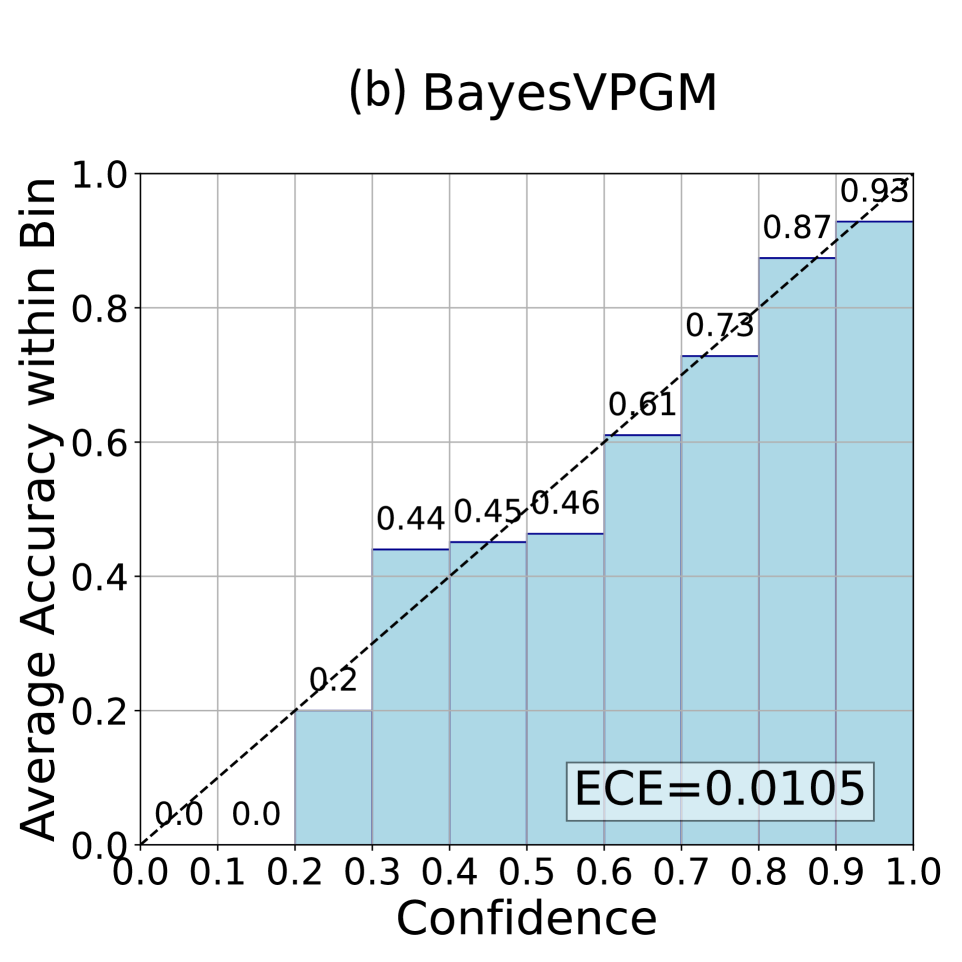
The image displays a reliability diagram (also known as a calibration plot) for a model or method labeled "BayesVPGM". This type of chart evaluates how well a model's predicted confidence scores align with its actual accuracy. The plot consists of a series of light blue bars representing binned confidence intervals and a dashed diagonal line representing perfect calibration.
### Components/Axes
* **Title:** "(b) BayesVPGM" (centered at the top).
* **X-Axis:** Labeled "Confidence". It represents the predicted probability or confidence score, ranging from 0.0 to 1.0 with major tick marks at every 0.1 interval.
* **Y-Axis:** Labeled "Average Accuracy within Bin". It represents the observed accuracy for predictions falling within a given confidence bin, ranging from 0.0 to 1.0 with major tick marks at every 0.2 interval.
* **Perfect Calibration Line:** A black dashed diagonal line running from the origin (0.0, 0.0) to the top-right corner (1.0, 1.0). This line represents the ideal scenario where confidence equals accuracy.
* **Data Series:** A series of light blue vertical bars. Each bar corresponds to a confidence bin (e.g., 0.0-0.1, 0.1-0.2, etc.). The height of each bar indicates the average accuracy for that bin.
* **Data Labels:** Numerical values are printed directly above each bar, indicating the precise average accuracy for that bin.
* **Metric Annotation:** A text box in the bottom-right quadrant of the chart area displays "ECE=0.0105". ECE stands for Expected Calibration Error, a summary metric of miscalibration.
### Detailed Analysis
The chart presents the following binned data points (Confidence Bin → Average Accuracy):
1. **Bin 0.0-0.1:** Accuracy = 0.0
2. **Bin 0.1-0.2:** Accuracy = 0.0
3. **Bin 0.2-0.3:** Accuracy = 0.2
4. **Bin 0.3-0.4:** Accuracy = 0.44
5. **Bin 0.4-0.5:** Accuracy = 0.45
6. **Bin 0.5-0.6:** Accuracy = 0.46
7. **Bin 0.6-0.7:** Accuracy = 0.61
8. **Bin 0.7-0.8:** Accuracy = 0.73
9. **Bin 0.8-0.9:** Accuracy = 0.87
10. **Bin 0.9-1.0:** Accuracy = 0.93
**Trend Verification:** The height of the bars (accuracy) shows a clear, consistent upward trend as the confidence bin increases from left to right. This positive correlation is the expected behavior for a well-calibrated model. The bars closely follow the trajectory of the dashed perfect calibration line.
### Key Observations
1. **Strong Calibration:** The model demonstrates excellent calibration. The observed accuracy for each bin is very close to the ideal value represented by the diagonal line. The largest deviations appear in the mid-range bins (0.3-0.6), where accuracy is slightly below the ideal line, indicating minor overconfidence in that range.
2. **Low Confidence Behavior:** For the lowest confidence bins (0.0-0.2), the model's accuracy is 0.0. This suggests that when the model is very uncertain, it is consistently incorrect, which is a valid and interpretable behavior.
3. **High Confidence Performance:** In the highest confidence bin (0.9-1.0), the model achieves an accuracy of 0.93. This indicates that when the model is most confident, it is correct 93% of the time, which is a strong performance.
4. **Quantified Error:** The Expected Calibration Error (ECE) is explicitly stated as 0.0105. This is a very low value, quantitatively confirming the visual assessment of good calibration. ECE is typically the weighted average of the absolute differences between confidence and accuracy across all bins.
### Interpretation
This reliability diagram provides strong evidence that the BayesVPGM model is **well-calibrated**. Its predicted confidence scores are reliable indicators of the likelihood of being correct.
* **Practical Implication:** A user can trust the model's confidence output. For instance, if the model makes a prediction with 80% confidence, we can expect it to be correct approximately 80% of the time (actual observed accuracy for the 0.8-0.9 bin is 87%, which is close).
* **Model Behavior:** The plot reveals the model's risk profile. It is appropriately cautious (low accuracy at low confidence) and appropriately assertive (high accuracy at high confidence). The slight under-confidence in the mid-range (0.3-0.6) is a minor and often acceptable deviation.
* **Metric Significance:** The ECE of 0.0105 is the key quantitative takeaway. In many machine learning contexts, an ECE below 0.05 is considered good, and below 0.02 is considered excellent. This value places BayesVPGM in the excellent category for calibration.
* **Context:** The "(b)" in the title suggests this is part of a larger figure, likely comparing the calibration of multiple models. BayesVPGM appears to be a strong performer in terms of calibration based on this single plot.