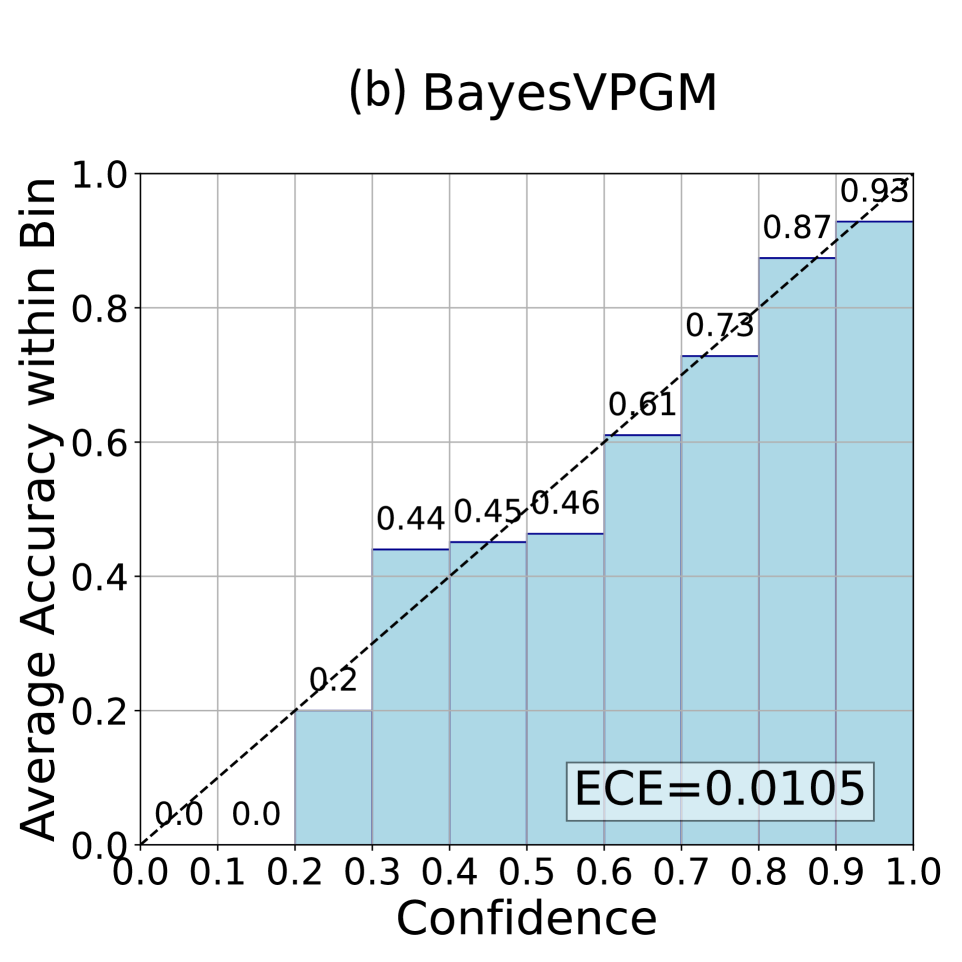
# Technical Document Extraction: BayesVPGM Chart Analysis
## Chart Overview
- **Title**: (b) BayesVPGM
- **Type**: Bar chart with trend line
- **Primary Axes**:
- **X-axis**: Confidence (0.0 to 1.0 in 0.1 increments)
- **Y-axis**: Average Accuracy within Bin (0.0 to 1.0)
## Key Components
1. **Bars**:
- **Color**: Blue (no explicit legend)
- **Data Points** (x-axis position → y-axis value):
- 0.2 → 0.2
- 0.3 → 0.44
- 0.4 → 0.45
- 0.5 → 0.46
- 0.6 → 0.61
- 0.7 → 0.73
- 0.8 → 0.87
- 0.9 → 0.93
- **Trend**: Bars show increasing height with higher confidence levels, forming an upward slope.
2. **Dashed Line**:
- **Path**: Diagonal from (0.0, 0.0) to (1.0, 1.0)
- **Purpose**: Likely represents a 1:1 reference line for accuracy vs. confidence.
3. **Text Elements**:
- **ECE Value**: `ECE=0.0105` (embedded in bottom-right corner, gray box with black text).
## Spatial Grounding
- **Legend**: Not explicitly present in the chart.
- **ECE Text**: Positioned at [x=0.85, y=0.15] (bottom-right quadrant).
## Trend Verification
- **Bars**: Steadily increase in height as confidence increases (e.g., 0.2 → 0.93).
- **Dashed Line**: Linear trend (slope = 1), but actual data points consistently exceed this line, indicating accuracy grows faster than confidence.
## Data Table Reconstruction
| Confidence | Average Accuracy |
|------------|------------------|
| 0.2 | 0.2 |
| 0.3 | 0.44 |
| 0.4 | 0.45 |
| 0.5 | 0.46 |
| 0.6 | 0.61 |
| 0.7 | 0.73 |
| 0.8 | 0.87 |
| 0.9 | 0.93 |
## Notes
- No non-English text detected.
- All numerical values extracted directly from bar labels and axis markers.
- No missing axis markers or labels identified.