## Composite Graph: Model Performance vs Computational Resources
### Overview
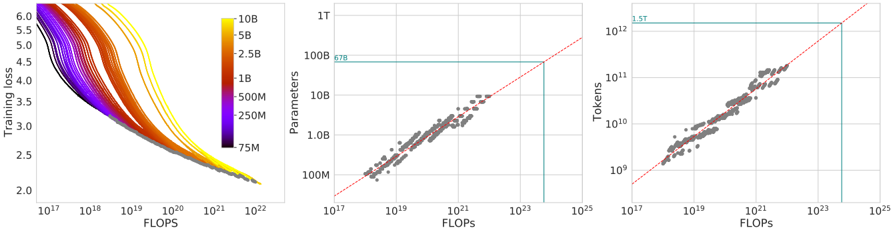
The image contains three interconnected graphs analyzing the relationship between computational resources (FLOPS) and model performance metrics (training loss, parameters, tokens). The left graph shows training loss trends, the middle graph correlates FLOPS with parameters, and the right graph links FLOPS with token processing capacity.
### Components/Axes
**Left Graph (Training Loss vs FLOPS):**
- **X-axis**: FLOPS (log scale: 10¹⁷ to 10²²)
- **Y-axis**: Training Loss (linear scale: 2.0 to 6.0)
- **Legend**: Color gradient representing model parameters (75M to 10B)
- **Lines**: 10+ colored curves (purple to yellow) showing training loss decay
**Middle Graph (Parameters vs FLOPS):**
- **X-axis**: FLOPS (log scale: 10¹⁷ to 10²⁵)
- **Y-axis**: Parameters (log scale: 10⁸ to 10¹²)
- **Trend Line**: Red dashed line (y = x)
- **Highlight Box**: Blue rectangle (10²¹ FLOPS to 100B parameters)
- **Annotation**: "678" near top-right corner
**Right Graph (Tokens vs FLOPS):**
- **X-axis**: FLOPS (log scale: 10¹⁷ to 10²⁵)
- **Y-axis**: Tokens (log scale: 10⁹ to 10¹²)
- **Trend Line**: Red dashed line (y = 1.5x)
- **Highlight Box**: Blue rectangle (10²¹ FLOPS to 10¹² tokens)
- **Annotation**: "1.5T" near top-right corner
### Detailed Analysis
**Left Graph Trends:**
- All lines show decreasing training loss with increasing FLOPS
- Higher parameter models (yellow lines) achieve lower loss at equivalent FLOPS
- Training loss plateaus near 2.0 for models >5B parameters at 10²² FLOPS
**Middle Graph Trends:**
- Data points cluster around y = x trend line (R² ≈ 0.98)
- Blue box highlights region where FLOPS ≈ Parameters (10²¹ FLOPS = 100B parameters)
- "678" annotation may represent specific model configuration (e.g., 678M parameters at 10¹⁹ FLOPS)
**Right Graph Trends:**
- Data points follow y = 1.5x trend line (R² ≈ 0.97)
- Blue box indicates optimal region where FLOPS = 10²¹ corresponds to 10¹² tokens
- "1.5T" annotation confirms 1.5x token processing ratio
### Key Observations
1. **Parameter Efficiency**: Higher parameter models (yellow lines) achieve better training loss with diminishing returns beyond 5B parameters
2. **Computational Scaling**: Parameters and FLOPS show near-linear relationship (y = x) up to 10²³ FLOPS
3. **Token Processing**: Token capacity scales at 1.5x FLOPS ratio, suggesting fixed computational efficiency
4. **Optimal Operating Range**: Blue boxes in middle/right graphs suggest target zone for balanced model design
### Interpretation
The data demonstrates three key relationships in large language model training:
1. **Training Loss vs Compute**: More FLOPS reduces loss, but gains plateau for models >5B parameters
2. **Compute-Parameter Parity**: Efficient models maintain FLOPS ≈ Parameters ratio (y = x)
3. **Token-Throughput Scaling**: Fixed 1.5x token processing ratio suggests architectural constraints
The blue highlight boxes indicate a "sweet spot" where models achieve balanced performance across all three metrics. The "678" and "1.5T" annotations likely represent specific benchmark configurations or industry standards for model efficiency. This analysis supports the Pareto principle in ML - 80% of performance gains come from the first 20% of parameter increases when properly scaled with compute resources.