## Circular Diagram: NLP Task Distribution Across Datasets
### Overview
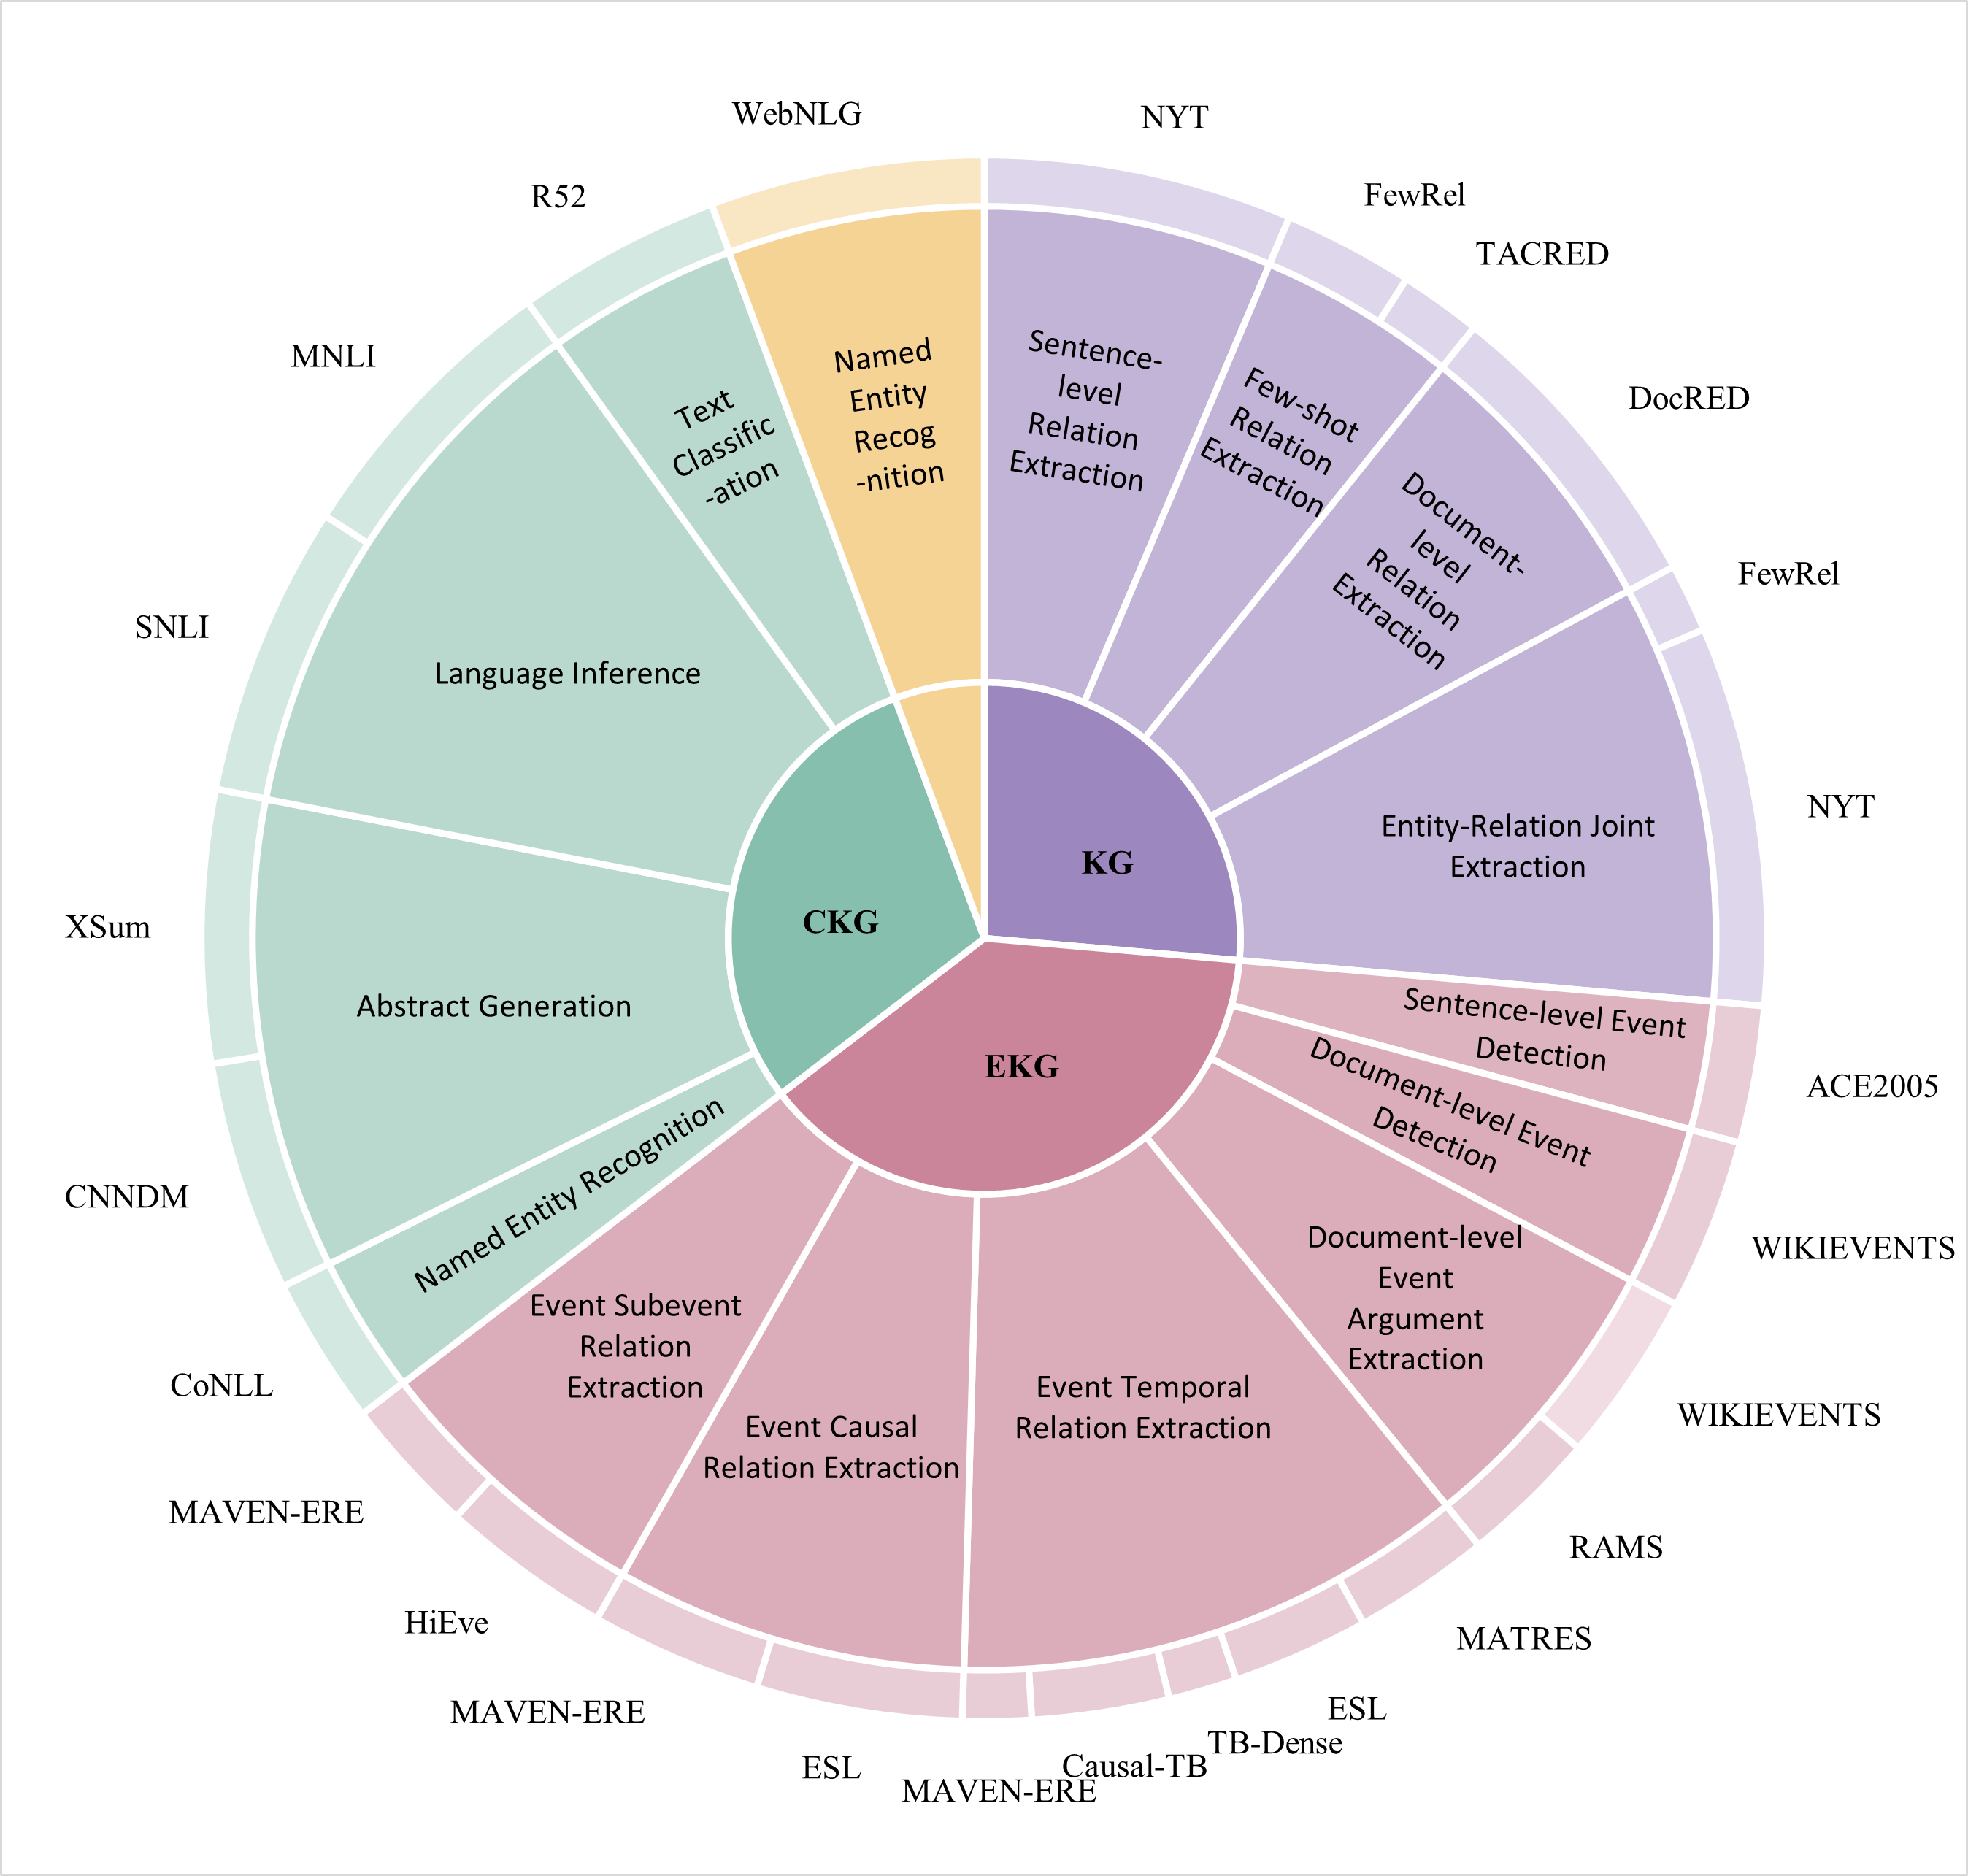
The image is a circular diagram illustrating the distribution of Natural Language Processing (NLP) tasks across various datasets. The diagram is divided into segments, each representing a dataset, and further subdivided to show the specific NLP tasks associated with that dataset. The size of each segment roughly corresponds to the relative importance or prevalence of the dataset and its tasks. The diagram uses color-coding to group related datasets or tasks.
### Components/Axes
* **Center:** The diagram has three concentric circles at its center, labeled "CKG" (light teal), "KG" (purple), and "EKG" (pink).
* **Datasets (Outer Ring):** The outer ring is divided into segments representing datasets. These include: MNLI, SNLI, XSum, CNNDM, CoNLL, MAVEN-ERE, HiEve, ESL, Causal-TB, TB-Dense, MATRES, RAMS, WIKIEVENTS, ACE2005, DocRED, TACRED, FewRel, NYT, WebNLG, and R52.
* **NLP Tasks (Inner Segments):** Each dataset segment is further divided into smaller segments representing specific NLP tasks. Examples include: Language Inference, Abstract Generation, Named Entity Recognition, Event Subevent Relation Extraction, Event Causal Relation Extraction, Event Temporal Relation Extraction, Event Argument Extraction, Sentence-level Event Detection, Document-level Event Detection, Entity-Relation Joint Extraction, Sentence-level Relation Extraction, Few-shot Relation Extraction, Document-level Relation Extraction, Text Classification, and Named Entity Recognition.
* **Color Coding:** The diagram uses color-coding to group related datasets or tasks. The colors are:
* Light Teal: MNLI, SNLI, XSum, CNNDM, CoNLL, CKG
* Pink: MAVEN-ERE, HiEve, ESL, Causal-TB, TB-Dense, MATRES, RAMS, WIKIEVENTS, ACE2005, EKG
* Purple: DocRED, TACRED, FewRel, NYT, KG
* Orange: WebNLG, R52
* **Labels:** Each segment is labeled with the name of the dataset or NLP task it represents.
### Detailed Analysis or Content Details
Here's a breakdown of the datasets and their associated tasks, organized by their position in the circular diagram, starting from the top and moving clockwise:
* **WebNLG (Orange):** No specific tasks are listed within the WebNLG segment.
* **R52 (Orange):** No specific tasks are listed within the R52 segment.
* **NYT (Purple):** Sentence-level Relation Extraction
* **FewRel (Purple):** Few-shot Relation Extraction
* **TACRED (Purple):** Document-level Relation Extraction
* **DocRED (Purple):** No specific tasks are listed within the DocRED segment.
* **FewRel (Purple):** No specific tasks are listed within the FewRel segment.
* **NYT (Purple):** Entity-Relation Joint Extraction
* **ACE2005 (Pink):** No specific tasks are listed within the ACE2005 segment.
* **WIKIEVENTS (Pink):** Sentence-level Event Detection, Document-level Event Detection
* **WIKIEVENTS (Pink):** Document-level Event Argument Extraction
* **RAMS (Pink):** No specific tasks are listed within the RAMS segment.
* **MATRES (Pink):** No specific tasks are listed within the MATRES segment.
* **ESL (Pink):** No specific tasks are listed within the ESL segment.
* **TB-Dense (Pink):** No specific tasks are listed within the TB-Dense segment.
* **Causal-TB (Pink):** No specific tasks are listed within the Causal-TB segment.
* **ESL (Pink):** No specific tasks are listed within the ESL segment.
* **MAVEN-ERE (Pink):** No specific tasks are listed within the MAVEN-ERE segment.
* **HiEve (Pink):** No specific tasks are listed within the HiEve segment.
* **MAVEN-ERE (Pink):** Event Temporal Relation Extraction, Event Causal Relation Extraction, Event Subevent Relation Extraction
* **CoNLL (Light Teal):** Named Entity Recognition
* **CNNDM (Light Teal):** No specific tasks are listed within the CNNDM segment.
* **XSum (Light Teal):** Abstract Generation
* **SNLI (Light Teal):** Language Inference
* **MNLI (Light Teal):** Text Classification
### Key Observations
* The diagram highlights the diversity of NLP tasks and the datasets used to train and evaluate models for these tasks.
* Some datasets are associated with a single task, while others are used for multiple tasks.
* The color-coding suggests groupings of datasets based on task type or origin.
* The central circles (CKG, KG, EKG) likely represent core knowledge graphs or resources used across multiple tasks and datasets.
### Interpretation
The circular diagram provides a visual representation of the NLP landscape, showing the relationships between datasets and tasks. It suggests that certain datasets are more specialized (e.g., focusing on a single task), while others are more versatile (supporting multiple tasks). The central position of CKG, KG, and EKG indicates their importance as foundational resources in the field. The diagram could be used to identify gaps in research (e.g., tasks with limited dataset support) or to explore potential transfer learning opportunities between related tasks and datasets. The diagram does not provide quantitative data, but rather a qualitative overview of the NLP domain.