\n
## Diagram: Whole-Proof Generation Pipeline
### Overview
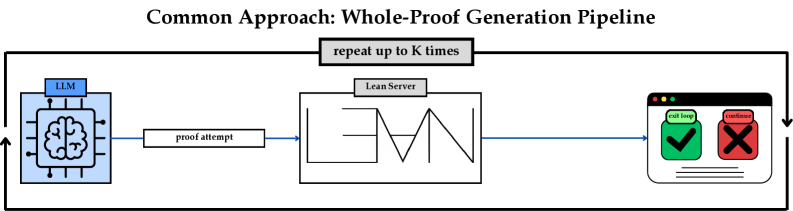
The image depicts a diagram illustrating a "Common Approach: Whole-Proof Generation Pipeline". It shows a cyclical process involving a Large Language Model (LLM), a Lean Server, and a confirmation/exit loop. The process is repeated up to K times.
### Components/Axes
The diagram consists of three main components:
1. **LLM:** Represented by a stylized brain with gears inside, topped with a blue cylinder labeled "LLM".
2. **Lean Server:** A rectangular block labeled "Lean Server" containing the letters "LVN" in a stylized font.
3. **Confirmation/Exit Loop:** A screen with two buttons: a green checkmark labeled "exit loop" and a red X labeled "continue".
There are also two text labels:
* "proof attempt" - connecting the LLM to the Lean Server.
* "repeat up to K times" - positioned above the Lean Server, indicating the iterative nature of the process.
### Detailed Analysis or Content Details
The diagram illustrates a flow of information:
1. The LLM generates a "proof attempt".
2. This attempt is sent to the Lean Server.
3. The Lean Server processes the attempt.
4. The Lean Server outputs a result, which is presented to a confirmation/exit loop.
5. The user (or an automated system) can choose to "exit loop" (green checkmark) or "continue" (red X).
6. If "continue" is selected, the process repeats from step 1, up to a maximum of K iterations.
The LLM is depicted in the top-left corner. The Lean Server occupies the central portion of the diagram. The confirmation/exit loop is located on the right side. The entire process is enclosed within a grey rectangular border.
### Key Observations
The diagram highlights an iterative approach to proof generation. The "K times" repetition suggests that the system is designed to refine the proof through multiple attempts. The Lean Server appears to be the core processing unit, while the LLM provides the initial proof attempts. The confirmation/exit loop allows for human or automated intervention in the process.
### Interpretation
This diagram illustrates a common workflow in automated theorem proving or formal verification. The LLM acts as a creative engine, generating potential proofs. The Lean Server serves as a rigorous validator, checking the correctness of the proof. The iterative loop allows the system to learn from its mistakes and improve the quality of the generated proofs. The parameter "K" represents the maximum number of attempts, balancing the computational cost of refinement against the desired level of confidence in the final proof. The diagram suggests a hybrid approach, combining the generative power of LLMs with the formal rigor of Lean-based verification systems. The use of "LVN" within the Lean Server block is unclear without further context, but could represent a specific algorithm or component within the server. The diagram is a high-level overview and does not provide details about the specific algorithms or techniques used in each component.