\n
## Diagram: Whole-Proof Generation Pipeline
### Overview
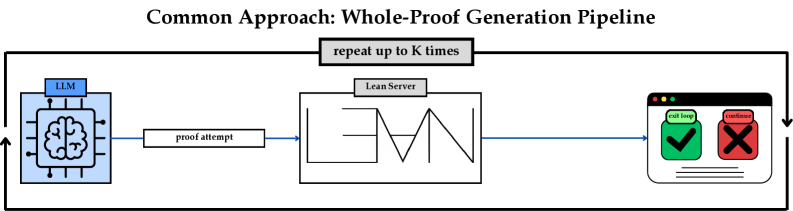
The image is a technical flowchart illustrating a "Common Approach: Whole-Proof Generation Pipeline." It depicts an iterative, automated process where a Large Language Model (LLM) attempts to generate a formal proof, which is then verified by a dedicated server. The process repeats until a proof is successfully verified or a maximum number of attempts is reached.
### Components/Axes
The diagram is structured as a linear flow with a feedback loop. There are no traditional chart axes. The primary components are:
1. **Title:** "Common Approach: Whole-Proof Generation Pipeline" (centered at the top).
2. **Process Loop Label:** "repeat up to K times" (centered above the main flow).
3. **Component 1 (Left):** A blue box labeled "LLM" containing a stylized brain icon with circuit-like connections.
4. **Component 2 (Center):** A white box labeled "Lean Server" containing a stylized line graph or waveform.
5. **Component 3 (Right):** A browser window icon displaying two possible outcomes:
* A green checkmark icon with the text "got it!" above it.
* A red 'X' icon with the text "nope!" above it.
6. **Flow Arrows:** Blue arrows connect the components in sequence: LLM -> proof attempt -> Lean Server -> Output Window. A black arrow loops from the output window back to the start of the LLM, indicating the iterative process.
### Detailed Analysis
* **LLM Block:** This represents the generative model. Its role is to produce a "proof attempt."
* **"proof attempt" Label:** This text is placed on the arrow connecting the LLM to the Lean Server, specifying the data being transmitted.
* **Lean Server Block:** This represents a verification engine (likely for the Lean theorem prover). Its internal graphic suggests analysis or processing of the proof attempt.
* **Output Window:** This represents the result of the verification step. The two icons represent a binary outcome:
* **Success State:** Green checkmark with "got it!" indicates the proof was accepted.
* **Failure State:** Red 'X' with "nope!" indicates the proof was rejected.
* **Iterative Loop:** The overarching black arrow and the "repeat up to K times" label define the core mechanism. The entire pipeline (generate -> verify -> check result) is repeated a maximum of K times. The loop implies that if a proof fails ("nope!"), the system returns to the LLM to generate a new attempt.
### Key Observations
1. **Binary Outcome:** The process has only two terminal states: success ("got it!") or failure after K attempts (implied by the loop limit).
2. **Centralized Verification:** The Lean Server acts as the single source of truth for validating the LLM's output.
3. **Trial-and-Error Framework:** The pipeline is fundamentally a search or retry mechanism, relying on repeated generation to find a correct proof.
4. **Visual Metaphors:** The brain icon symbolizes the generative intelligence of the LLM, while the waveform in the Lean Server suggests analytical processing.
### Interpretation
This diagram illustrates a common paradigm in neuro-symbolic AI or automated theorem proving. It shows a hybrid system where a neural network (LLM) is used for its creative, generative capacity to propose solutions (proofs), but its outputs are strictly validated by a symbolic, deterministic system (the Lean Server). The "repeat up to K times" loop is critical; it acknowledges that the LLM's first attempt is often incorrect, and success relies on iterative refinement guided by the verifier's feedback (the "nope!" signal). This approach leverages the strengths of both AI types: the LLM's ability to navigate vast possibility spaces and the verifier's guarantee of formal correctness. The pipeline's efficiency would heavily depend on the value of K and the LLM's ability to learn from or be guided by previous failure signals.