# Technical Data Extraction: Norm Ratio across Model Layers
## 1. Image Metadata & Component Isolation
* **Type:** Line Graph with markers.
* **Header/Title:** None present in the image.
* **Main Chart Region:** Contains two data series plotted against 32 layers (0-31).
* **Legend Location:** Top-center [approx. x=0.5, y=0.9].
* **Language:** English.
## 2. Axis Definitions
* **X-Axis (Horizontal):**
* **Label:** "Layers"
* **Range:** 0 to 31.
* **Major Markers:** 0, 5, 10, 15, 20, 25, 30.
* **Y-Axis (Vertical):**
* **Label:** "Norm Ratio"
* **Range:** 0.96 to 1.01 (with data points extending slightly below 0.96 and above 1.01).
* **Major Markers:** 0.96, 0.97, 0.98, 0.99, 1.00, 1.01.
## 3. Legend and Data Series Identification
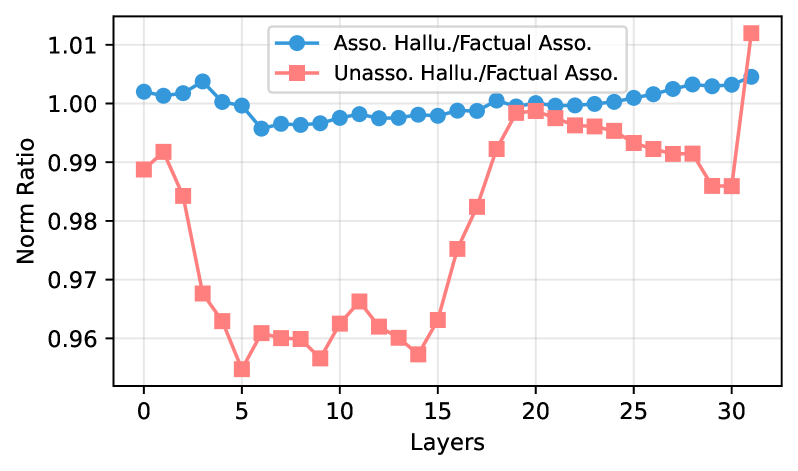
* **Series 1 (Blue Circles):** `Asso. Hallu./Factual Asso.`
* **Visual Trend:** Relatively stable. It starts slightly above 1.00, dips marginally between layers 5-15, and then shows a very gradual upward slope toward the final layers, ending near 1.005.
* **Series 2 (Red Squares):** `Unasso. Hallu./Factual Asso.`
* **Visual Trend:** Highly volatile. It starts near 0.99, drops sharply to a local minimum around layer 5 (~0.955), fluctuates at a low level until layer 15, then rises sharply to peak at layer 20 (~0.998). It then declines gradually until layer 30 before a final sharp spike at layer 31.
## 4. Data Point Extraction (Estimated Values)
| Layer | Asso. Hallu./Factual Asso. (Blue) | Unasso. Hallu./Factual Asso. (Red) |
| :--- | :--- | :--- |
| 0 | 1.002 | 0.989 |
| 1 | 1.001 | 0.992 |
| 2 | 1.002 | 0.984 |
| 3 | 1.004 | 0.968 |
| 4 | 1.000 | 0.963 |
| 5 | 0.999 | 0.955 |
| 6 | 0.996 | 0.961 |
| 7 | 0.997 | 0.960 |
| 8 | 0.996 | 0.960 |
| 9 | 0.997 | 0.957 |
| 10 | 0.998 | 0.963 |
| 11 | 0.998 | 0.966 |
| 12 | 0.997 | 0.962 |
| 13 | 0.998 | 0.960 |
| 14 | 0.998 | 0.957 |
| 15 | 0.998 | 0.963 |
| 16 | 0.999 | 0.975 |
| 17 | 0.999 | 0.983 |
| 18 | 1.001 | 0.992 |
| 19 | 1.000 | 0.998 |
| 20 | 1.000 | 0.999 |
| 21 | 0.999 | 0.997 |
| 22 | 1.000 | 0.996 |
| 23 | 1.000 | 0.996 |
| 24 | 1.001 | 0.995 |
| 25 | 1.001 | 0.993 |
| 26 | 1.002 | 0.992 |
| 27 | 1.003 | 0.991 |
| 28 | 1.003 | 0.991 |
| 29 | 1.003 | 0.986 |
| 30 | 1.003 | 0.986 |
| 31 | 1.005 | 1.012 |
## 5. Key Observations
* **Divergence:** The most significant divergence between the two metrics occurs in the "middle" layers (approximately layers 3 through 17), where the Unassociated Hallucination ratio drops significantly below the Associated Hallucination ratio.
* **Convergence:** The two lines converge most closely around layer 20.
* **Final Layer Behavior:** Both metrics show a sharp increase at the final layer (31), with the Red series (Unassociated) jumping from a low point to its maximum value on the chart, exceeding the Blue series for the first time.