## Line Chart: Normalized Ratio of Hallucinations to Factual Associations vs. Layers
### Overview
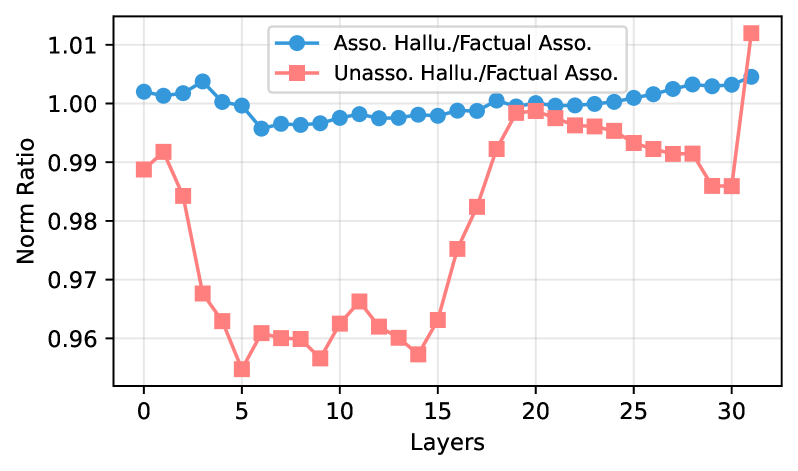
This line chart depicts the relationship between the number of layers in a model and the normalized ratio of hallucinations to factual associations. Two data series are presented: one for "Asso. Hallu./Factual Asso." (Association Hallucination/Factual Association) and another for "Unasso. Hallu./Factual Asso." (Unassociated Hallucination/Factual Association). The chart aims to illustrate how the propensity for hallucinations changes as model depth (number of layers) increases.
### Components/Axes
* **X-axis:** "Layers" - ranging from 0 to 32, with tick marks at integer values.
* **Y-axis:** "Norm Ratio" - ranging from approximately 0.95 to 1.02, with tick marks at 0.96, 0.97, 0.98, 0.99, 1.00, and 1.01.
* **Legend:** Located in the top-center of the chart.
* "Asso. Hallu./Factual Asso." - represented by a blue line with circular markers.
* "Unasso. Hallu./Factual Asso." - represented by a red line with square markers.
* **Gridlines:** Horizontal and vertical gridlines are present to aid in reading values.
### Detailed Analysis
**Asso. Hallu./Factual Asso. (Blue Line):**
The blue line starts at approximately 1.005 at Layer 0, then generally slopes downward until around Layer 8, reaching a minimum of approximately 0.985. From Layer 8 to Layer 20, the line remains relatively stable, fluctuating between approximately 0.985 and 1.00. After Layer 20, the line exhibits an upward trend, reaching approximately 1.01 at Layer 32.
* Layer 0: ~1.005
* Layer 2: ~1.003
* Layer 4: ~0.998
* Layer 6: ~0.993
* Layer 8: ~0.988
* Layer 10: ~0.987
* Layer 12: ~0.989
* Layer 14: ~0.991
* Layer 16: ~0.993
* Layer 18: ~0.996
* Layer 20: ~0.998
* Layer 22: ~1.001
* Layer 24: ~1.003
* Layer 26: ~1.005
* Layer 28: ~1.007
* Layer 30: ~1.009
* Layer 32: ~1.01
**Unasso. Hallu./Factual Asso. (Red Line):**
The red line begins at approximately 0.995 at Layer 0, decreasing to a minimum of approximately 0.958 around Layer 6. From Layer 6 to Layer 16, the line gradually increases, reaching approximately 0.985 at Layer 16. Between Layer 16 and Layer 24, the line continues to rise, reaching a peak of approximately 1.002 at Layer 24. After Layer 24, the line declines slightly, ending at approximately 0.995 at Layer 32.
* Layer 0: ~0.995
* Layer 2: ~0.993
* Layer 4: ~0.988
* Layer 6: ~0.958
* Layer 8: ~0.962
* Layer 10: ~0.965
* Layer 12: ~0.969
* Layer 14: ~0.975
* Layer 16: ~0.985
* Layer 18: ~0.992
* Layer 20: ~0.996
* Layer 22: ~0.999
* Layer 24: ~1.002
* Layer 26: ~1.000
* Layer 28: ~0.998
* Layer 30: ~0.996
* Layer 32: ~0.995
### Key Observations
* The "Unasso. Hallu./Factual Asso." ratio exhibits a more pronounced decrease in the early layers (0-6) compared to the "Asso. Hallu./Factual Asso." ratio.
* Both ratios show a general trend of increasing with the number of layers beyond 20 layers.
* The "Asso. Hallu./Factual Asso." ratio remains consistently higher than the "Unasso. Hallu./Factual Asso." ratio throughout the observed range of layers.
### Interpretation
The chart suggests that increasing the number of layers in the model initially reduces the ratio of both associated and unassociated hallucinations to factual associations. However, beyond a certain depth (around 20 layers in this case), adding more layers appears to *increase* the propensity for hallucinations, particularly for associated hallucinations. This could indicate that deeper models, while capable of more complex representations, are also more prone to generating outputs that are not grounded in factual information. The difference between the two lines suggests that associated hallucinations are more prevalent than unassociated ones, and that this difference is maintained as the model depth increases. This could be due to the model learning spurious correlations in the training data, leading to hallucinations that are related to the input but not factually accurate. The initial decrease in hallucination ratio could be attributed to the model learning more robust representations in the early layers, while the subsequent increase could be due to overfitting or the emergence of unintended behaviors in deeper layers.