## Layer-wise Normalized Ratio Comparison Chart
### Overview
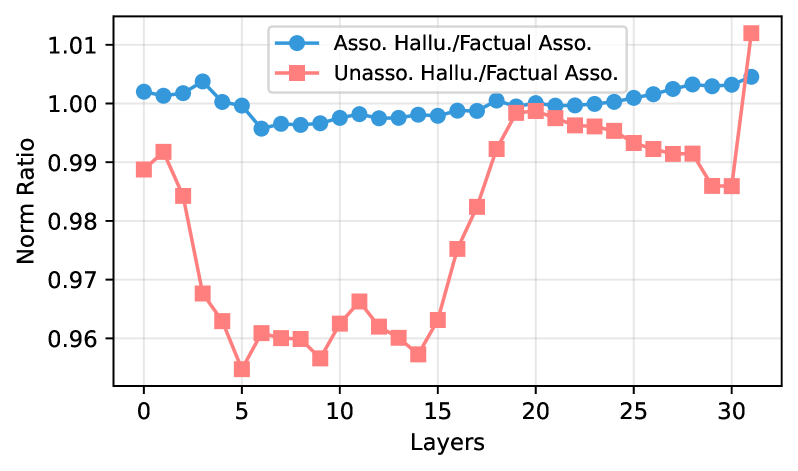
The image is a line chart comparing two normalized ratio metrics across 32 layers (indexed 0 to 31) of a model or system. The chart plots the "Norm Ratio" on the y-axis against "Layers" on the x-axis. It features two distinct data series, differentiated by color and marker shape, as defined in a legend positioned at the top-center of the plot area.
### Components/Axes
* **Chart Type:** Line chart with markers.
* **X-Axis:**
* **Label:** "Layers"
* **Scale:** Linear, ranging from 0 to 30, with major tick marks every 5 units (0, 5, 10, 15, 20, 25, 30). The data extends to layer 31.
* **Y-Axis:**
* **Label:** "Norm Ratio"
* **Scale:** Linear, ranging from approximately 0.96 to 1.01, with major tick marks at 0.96, 0.97, 0.98, 0.99, 1.00, and 1.01.
* **Legend:** Located in the top-center region of the chart.
* **Series 1:** Label: "Asso. Hallu./Factual Asso." | Color: Blue | Marker: Circle (●) | Line: Solid blue.
* **Series 2:** Label: "Unasso. Hallu./Factual Asso." | Color: Light Red/Salmon | Marker: Square (■) | Line: Solid light red/salmon.
* **Grid:** A light gray grid is present for both major x and y ticks.
### Detailed Analysis
**Series 1: Asso. Hallu./Factual Asso. (Blue Line, Circle Markers)**
* **Trend:** This series exhibits a relatively stable trend with a shallow, broad dip in the early-to-mid layers. It starts above 1.00, decreases to a minimum around layer 6, and then gradually recovers, ending at its highest point.
* **Approximate Data Points (Key Layers):**
* Layer 0: ~1.002
* Layer 3: ~1.004 (local peak)
* Layer 6: ~0.996 (approximate minimum)
* Layer 15: ~0.999
* Layer 20: ~1.000
* Layer 31: ~1.005 (approximate maximum)
**Series 2: Unasso. Hallu./Factual Asso. (Light Red Line, Square Markers)**
* **Trend:** This series shows high volatility. It begins below 1.00, experiences a sharp decline to a deep trough in the early layers (5-15), followed by a steep and sustained increase through the later layers, ultimately surpassing the blue series at the final layer.
* **Approximate Data Points (Key Layers):**
* Layer 0: ~0.989
* Layer 1: ~0.992 (local peak before drop)
* Layer 5: ~0.955 (approximate global minimum)
* Layer 10: ~0.963
* Layer 15: ~0.963
* Layer 18: ~0.992
* Layer 20: ~0.999
* Layer 25: ~0.993
* Layer 30: ~0.986
* Layer 31: ~1.012 (approximate global maximum, sharp spike)
### Key Observations
1. **Contrasting Volatility:** The "Unasso." series (red) is far more volatile than the "Asso." series (blue), with a much larger range of values (~0.955 to ~1.012 vs. ~0.996 to ~1.005).
2. **Divergent Early Behavior:** In the first 15 layers, the two series move in opposite directions. The blue series dips slightly, while the red series plummets to its lowest values.
3. **Convergence and Crossover:** The series converge around layers 19-20, where both are near 1.00. After layer 20, the red series generally declines while the blue series slowly rises, until a dramatic final spike in the red series at layer 31 causes it to exceed the blue series for the first and only time.
4. **Minimum Points:** The minimum for the blue series occurs around layer 6, while the red series hits its minimum earlier, around layer 5.
### Interpretation
This chart likely visualizes a metric comparing the prevalence or strength of "hallucinations" (unfounded associations) relative to "factual associations" across different layers of a neural network or similar hierarchical model. The "Norm Ratio" suggests a normalized comparison.
* **"Asso. Hallu./Factual Asso." (Blue):** This ratio remains close to 1.00 across all layers, indicating that *associated* hallucinations (perhaps those linked to some contextual or semantic cue) maintain a fairly constant relationship with factual associations throughout the model's processing depth. The shallow dip suggests a slight relative decrease in associated hallucinations in the early-middle layers.
* **"Unasso. Hallu./Factual Asso." (Red):** This ratio shows a dramatic U-shaped pattern. The deep trough in layers 5-15 suggests that in the early-to-middle processing stages, *unassociated* hallucinations (random or baseless errors) are significantly suppressed relative to factual knowledge. The steep rise thereafter indicates that in deeper layers, these unassociated errors become increasingly prominent, even surpassing the factual association baseline at the very end (layer 31). This could imply that later layers are more prone to generating or amplifying unsupported inferences.
**Overall Implication:** The model's processing appears to have distinct phases. Early/mid layers are highly effective at filtering out unassociated noise (red line low), while maintaining a stable baseline of associated errors (blue line stable). Later layers, however, show a breakdown in this filtering for unassociated errors, leading to a surge in their relative presence. The final spike is a notable anomaly, suggesting a potential point of instability or a specific phenomenon occurring at the model's output layer.