## Line Graph: Norm Ratio vs. Layers
### Overview
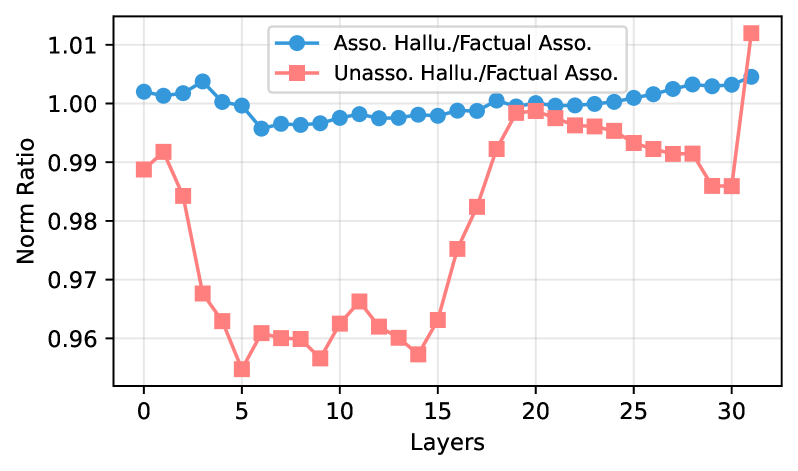
The image depicts a line graph comparing two data series across 31 layers (0–30). The blue line (circles) represents "Asso. Hallu./Factual Asso." and the red line (squares) represents "Unasso. Hallu./Factual Asso." Both axes are labeled, with the y-axis showing "Norm Ratio" (0.95–1.01) and the x-axis showing "Layers" (0–30). The legend is positioned in the top-right corner.
### Components/Axes
- **X-axis (Layers)**: Incremented by 5, ranging from 0 to 30.
- **Y-axis (Norm Ratio)**: Incremented by 0.01, ranging from 0.95 to 1.01.
- **Legend**: Top-right corner, with blue circles for "Asso. Hallu./Factual Asso." and red squares for "Unasso. Hallu./Factual Asso."
### Detailed Analysis
#### Asso. Hallu./Factual Asso. (Blue Line)
- **Trend**: Starts at 1.00 (Layer 0), dips slightly to ~0.995 at Layer 5, then stabilizes near 1.00 with minor fluctuations (e.g., 1.002 at Layer 15, 1.005 at Layer 30).
- **Key Data Points**:
- Layer 0: 1.00
- Layer 5: ~0.995
- Layer 10: ~0.998
- Layer 15: ~1.002
- Layer 20: ~1.001
- Layer 25: ~1.003
- Layer 30: ~1.005
#### Unasso. Hallu./Factual Asso. (Red Line)
- **Trend**: Starts at ~0.99 (Layer 0), drops sharply to ~0.96 at Layer 5, fluctuates between 0.96–0.99 until Layer 15, then rises sharply to ~1.01 at Layer 30.
- **Key Data Points**:
- Layer 0: ~0.99
- Layer 5: ~0.96
- Layer 10: ~0.97
- Layer 15: ~0.98
- Layer 20: ~0.995
- Layer 25: ~0.992
- Layer 30: ~1.01
### Key Observations
1. **Blue Line Stability**: The "Asso. Hallu./Factual Asso." ratio remains relatively stable, with minor deviations (±0.005) across all layers.
2. **Red Line Volatility**: The "Unasso. Hallu./Factual Asso." ratio exhibits significant fluctuations, dropping to a minimum of ~0.96 at Layer 5 and peaking at ~1.01 at Layer 30.
3. **Divergence at Layer 30**: Both lines converge near 1.00–1.01 at the final layer, suggesting a potential normalization effect.
### Interpretation
- The blue line's stability implies that "Asso. Hallu./Factual Asso." maintains consistency across layers, possibly indicating robust performance or equilibrium.
- The red line's volatility suggests "Unasso. Hallu./Factual Asso." experiences instability, with a sharp recovery at Layer 30. This could indicate a corrective mechanism or external influence at the final layer.
- The divergence at Layer 30 highlights a critical point where both metrics align, potentially signaling a threshold or system adjustment. The red line's sharp rise may reflect an outlier or a designed response to earlier instability.