## Diagram: Imandra Region Explorer - Decompose match_price
### Overview
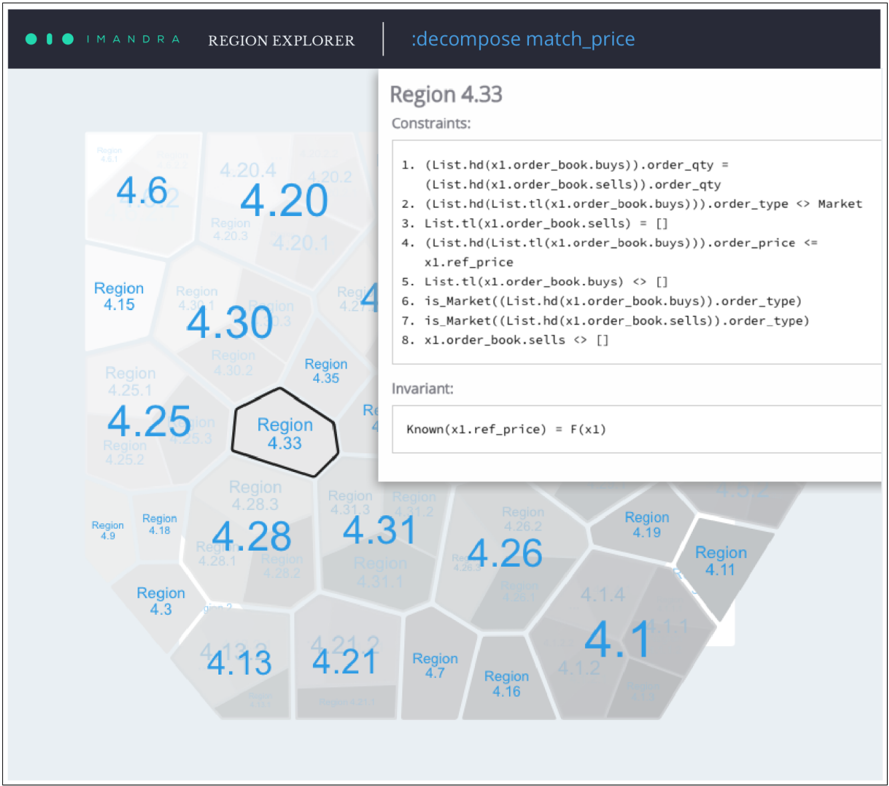
The image is a screenshot of a software interface titled "IMANDRA REGION EXPLORER". The primary focus is a detailed view of a specific region, "Region 4.33", within a larger hexagonal grid map. A pop-up window overlays the grid, displaying formal logical constraints and an invariant associated with this selected region. The interface appears to be a tool for formal verification or analysis, likely related to financial systems or order book logic.
### Components/Axes
1. **Header Bar:**
* Left: "IMANDRA" logo (three teal dots followed by the text).
* Center: "REGION EXPLORER".
* Right: ":decompose match_price" (appears to be a command or function name).
2. **Main Visualization (Hexagonal Grid):**
* A map composed of interconnected hexagonal cells, each labeled as a "Region" with a numerical identifier (e.g., "Region 4.6", "Region 4.20").
* Each hexagon contains a large, prominent blue number (e.g., 4.6, 4.20, 4.30, 4.25, 4.28, 4.31, 4.26, 4.1). These numbers likely represent a key metric or value for that region.
* The hexagons are shaded in varying tones of gray, possibly indicating a secondary metric or state.
* **Spatial Grounding:** The grid fills the left and bottom portions of the view. "Region 4.33" is centrally located and is highlighted with a thick black border, indicating it is the currently selected region.
3. **Pop-up Detail Window (Top-Right):**
* **Title:** "Region 4.33"
* **Section 1: "Constraints:"** A numbered list of 8 formal logical statements.
* **Section 2: "Invariant:"** A single formal statement.
* The window has a white background and casts a slight shadow over the grid beneath it.
### Detailed Analysis
**A. Hexagonal Grid Data Points (Approximate Values & Labels):**
The visible regions and their primary blue numbers are:
* Top-left cluster: Region 4.6 (4.6), Region 4.20 (4.20), Region 4.20.4, Region 4.20.2, Region 4.20.3, Region 4.20.1.
* Left-center: Region 4.15, Region 4.30 (4.30), Region 4.30.2, Region 4.25 (4.25), Region 4.25.1, Region 4.25.2, Region 4.25.3.
* **Center (Selected):** Region 4.33 (highlighted).
* Right-center: Region 4.35, Region 4.31 (4.31), Region 4.31.3, Region 4.31.2, Region 4.31.1, Region 4.26 (4.26), Region 4.26.2, Region 4.19.
* Bottom-left: Region 4.9, Region 4.18, Region 4.28 (4.28), Region 4.28.1, Region 4.28.2, Region 4.3 (4.3), Region 4.13 (4.13).
* Bottom-center/right: Region 4.21 (4.21), Region 4.21.2, Region 4.7, Region 4.16, Region 4.1 (4.1), Region 4.1.4, Region 4.1.2, Region 4.11.
**B. Transcribed Text from Pop-up Window for "Region 4.33":**
**Constraints:**
1. `(List.hd(x1.order_book.buys)).order_qty = (List.hd(x1.order_book.sells)).order_qty`
2. `(List.hd(List.tl(x1.order_book.buys))).order_type <> Market`
3. `List.tl(x1.order_book.sells) = []`
4. `(List.hd(List.tl(x1.order_book.buys))).order_price <= x1.ref_price`
5. `List.tl(x1.order_book.buys) <> []`
6. `is_Market((List.hd(x1.order_book.buys)).order_type)`
7. `is_Market((List.hd(x1.order_book.sells)).order_type)`
8. `x1.order_book.sells <> []`
**Invariant:**
`Known(x1.ref_price) = F(x1)`
### Key Observations
1. **Hierarchical Labeling:** Regions have a primary number (e.g., 4.33) and can have sub-regions denoted by additional decimals (e.g., 4.20.1, 4.25.3).
2. **Visual Emphasis:** The selected region (4.33) is emphasized with a bold border, and its details are shown in a separate, focused window.
3. **Formal Logic Syntax:** The constraints use a LISP-like syntax (`List.hd`, `List.tl`, `<>`, `[]`) and domain-specific predicates (`is_Market`), indicating this is output from a formal methods or automated reasoning tool.
4. **Content of Constraints:** The constraints describe specific, mutually exclusive conditions on an `order_book` structure containing `buys` and `sells` lists. They reference properties like `order_qty`, `order_type`, and `order_price` in relation to a `ref_price`.
5. **Grid Layout:** The hexagonal tiling suggests a state space or partition of possibilities, where each cell represents a distinct set of conditions (the constraints) governing the system's behavior.
### Interpretation
This image depicts a state-space exploration tool for formally verifying a system, likely a financial matching engine or order book processor. The "Region Explorer" visualizes a partitioned state space where each hexagonal region corresponds to a unique combination of logical conditions (constraints) that can hold true for a system state (`x1`).
* **What the data suggests:** The tool has decomposed the complex behavior of a function named `match_price` into distinct regions. Region 4.33 represents one specific scenario where the order book has particular properties: the top buy and sell orders have equal quantity, the second buy order is not a market order, there is only one sell order, its price is at or below a reference price, there are multiple buy orders, and both top orders are market orders.
* **How elements relate:** The hexagonal grid is the primary map of all discovered behavioral regions. Clicking on a region (like 4.33) drills down into the precise formal specification that defines it. The invariant `Known(x1.ref_price) = F(x1)` suggests that within this region, the reference price is a known function of the state `x1`.
* **Notable patterns/anomalies:** The existence of sub-regions (e.g., 4.20.1) implies a hierarchical or nested structure within the state space. The constraints are highly specific and mutually exclusive, defining a narrow "corner" of possible system behaviors. This level of detail is characteristic of formal verification, where engineers seek to prove system properties under all possible conditions by exhaustively analyzing such regions. The tool helps manage the complexity of this analysis by providing a visual and navigable interface to the underlying formal model.