## Chart Type: Zoomed-in ROC Curve (Log-scaled FPR)
### Overview
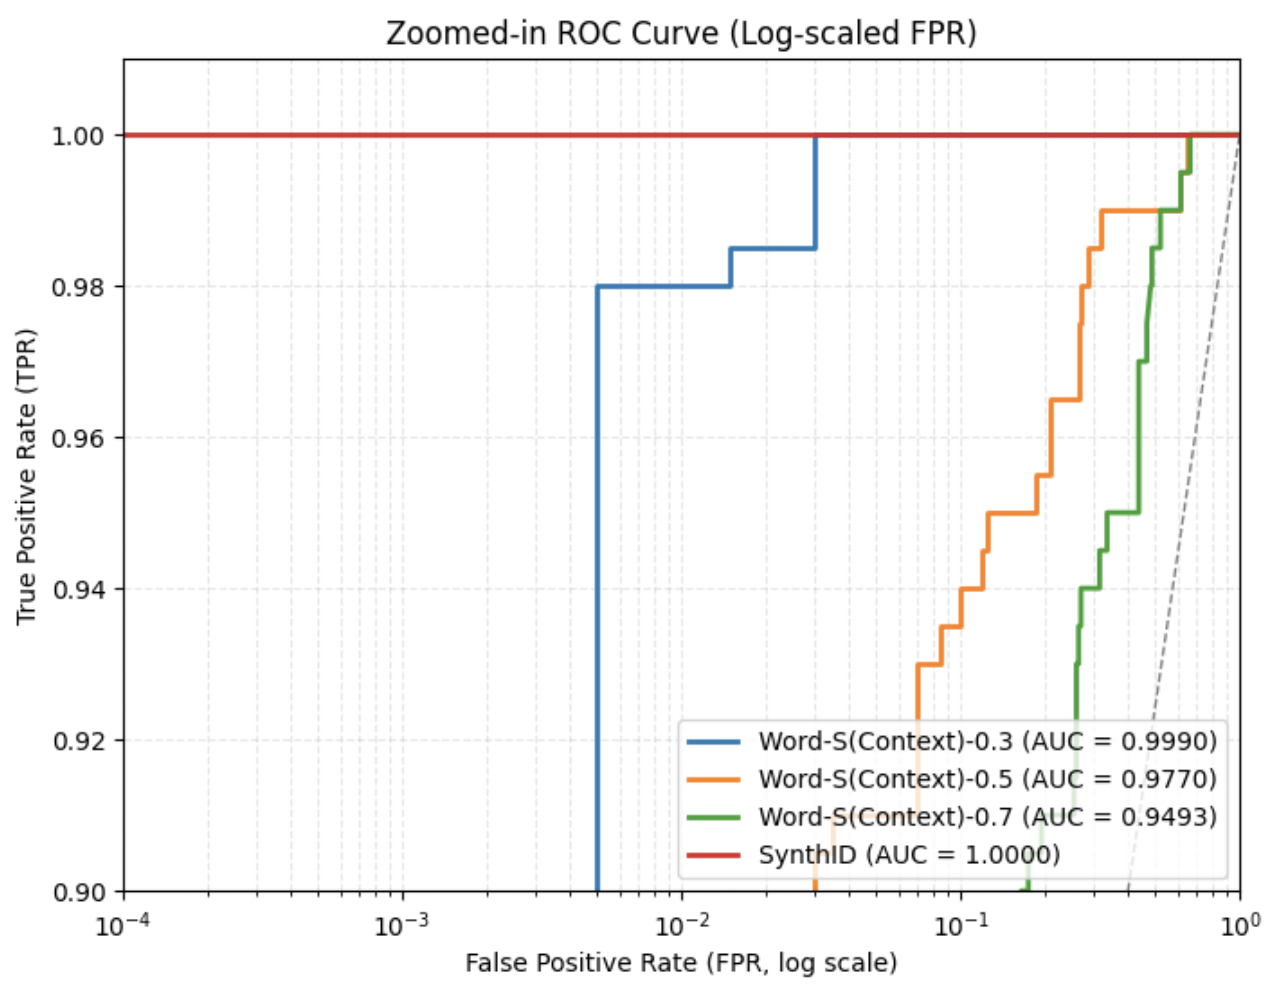
The image displays a zoomed-in Receiver Operating Characteristic (ROC) curve comparing the performance of three Word-S(Context) models (with context values 0.3, 0.5, and 0.7) against a SynthID baseline. The x-axis uses a logarithmic scale for False Positive Rate (FPR), while the y-axis shows True Positive Rate (TPR). All lines are plotted on a grid with dashed reference lines at TPR=0.98 and FPR=0.01.
### Components/Axes
- **X-axis**: False Positive Rate (FPR, log scale) ranging from 10⁻⁴ to 10⁰ (1.0).
- **Y-axis**: True Positive Rate (TPR) ranging from 0.90 to 1.00.
- **Legend**:
- Blue: Word-S(Context)-0.3 (AUC = 0.9990)
- Orange: Word-S(Context)-0.5 (AUC = 0.9770)
- Green: Word-S(Context)-0.7 (AUC = 0.9493)
- Red: SynthID (AUC = 1.0000)
- **Grid**: Dashed lines at TPR=0.98 and FPR=0.01 for reference.
### Detailed Analysis
1. **Word-S(Context)-0.3 (Blue Line)**:
- Dominates the chart, maintaining TPR ≈ 1.00 across all FPR values.
- Sharp drop to TPR=1.00 at FPR=10⁻², then remains flat.
- AUC = 0.9990 (highest performance).
2. **Word-S(Context)-0.5 (Orange Line)**:
- Starts at TPR=1.00 for FPR < 10⁻².
- Gradual decline in TPR as FPR increases, forming a stepwise curve.
- AUC = 0.9770 (moderate performance).
3. **Word-S(Context)-0.7 (Green Line)**:
- Worst-performing model, with TPR dropping sharply at FPR=10⁻¹.
- Steep decline to TPR=0.94 by FPR=10⁻⁰.
- AUC = 0.9493 (lowest performance).
4. **SynthID (Red Line)**:
- Perfect diagonal line (AUC = 1.0000), representing the theoretical baseline.
- No deviation from the 45° reference line.
### Key Observations
- **Performance Hierarchy**: Word-S(Context)-0.3 > Word-S(Context)-0.5 > Word-S(Context)-0.7.
- **Log Scale Impact**: The logarithmic FPR scale compresses low-FPR regions, emphasizing differences in high-FPR regimes.
- **Baseline Anomaly**: SynthID’s AUC=1.0000 is theoretically impossible in practice, suggesting either idealized data or a mislabeled baseline.
### Interpretation
The chart demonstrates that reducing context values (e.g., 0.3 vs. 0.7) improves model performance in terms of TPR while maintaining low FPR. The SynthID baseline’s perfect AUC is unrealistic, indicating either a theoretical construct or a data artifact. The zoomed-in view highlights critical performance thresholds near TPR=0.98 and FPR=0.01, where Word-S(Context)-0.3 outperforms others by orders of magnitude in FPR reduction. This suggests context-sensitive tuning is critical for high-stakes applications requiring near-perfect recall.