## Bar Chart: Model Performance on Logical Fallacies
### Overview
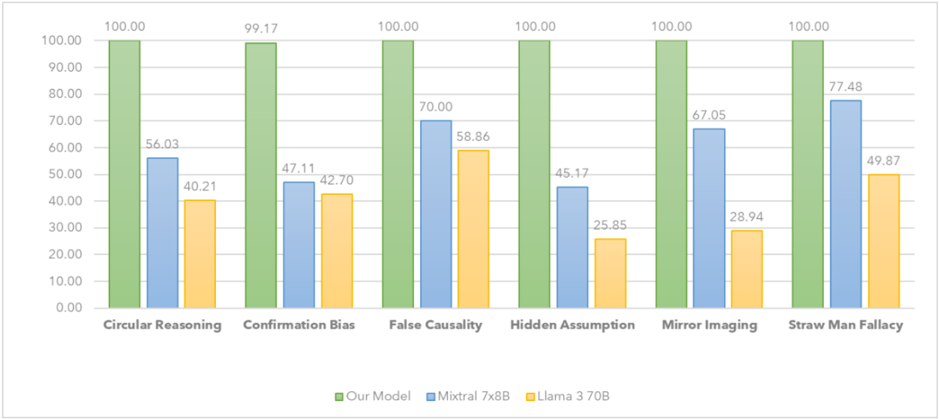
The image is a bar chart comparing the performance of three models ("Our Model", "Mixtral 7x8B", and "Llama 3 70B") across six different logical fallacies: Circular Reasoning, Confirmation Bias, False Causality, Hidden Assumption, Mirror Imaging, and Straw Man Fallacy. The y-axis represents a percentage score, ranging from 0.00 to 100.00.
### Components/Axes
* **X-axis:** Logical Fallacies (Circular Reasoning, Confirmation Bias, False Causality, Hidden Assumption, Mirror Imaging, Straw Man Fallacy)
* **Y-axis:** Percentage Score (ranging from 0.00 to 100.00, with increments of 10.00)
* **Legend:** Located at the bottom of the chart.
* Green: Our Model
* Blue: Mixtral 7x8B
* Yellow: Llama 3 70B
### Detailed Analysis
Here's a breakdown of the performance of each model on each fallacy:
* **Circular Reasoning:**
* Our Model (Green): 100.00
* Mixtral 7x8B (Blue): 56.03
* Llama 3 70B (Yellow): 40.21
* **Confirmation Bias:**
* Our Model (Green): 99.17
* Mixtral 7x8B (Blue): 47.11
* Llama 3 70B (Yellow): 42.70
* **False Causality:**
* Our Model (Green): 100.00
* Mixtral 7x8B (Blue): 70.00
* Llama 3 70B (Yellow): 58.86
* **Hidden Assumption:**
* Our Model (Green): 100.00
* Mixtral 7x8B (Blue): 45.17
* Llama 3 70B (Yellow): 25.85
* **Mirror Imaging:**
* Our Model (Green): 100.00
* Mixtral 7x8B (Blue): 67.05
* Llama 3 70B (Yellow): 28.94
* **Straw Man Fallacy:**
* Our Model (Green): 100.00
* Mixtral 7x8B (Blue): 77.48
* Llama 3 70B (Yellow): 49.87
### Key Observations
* "Our Model" consistently achieves near-perfect (100.00 or 99.17) performance across all logical fallacies.
* "Mixtral 7x8B" generally outperforms "Llama 3 70B" on most fallacies, but both lag significantly behind "Our Model".
* The largest performance difference between "Mixtral 7x8B" and "Llama 3 70B" is observed in "Mirror Imaging", where "Mixtral 7x8B" scores 67.05 compared to "Llama 3 70B"'s 28.94.
* The smallest performance difference between "Mixtral 7x8B" and "Llama 3 70B" is observed in "Confirmation Bias", where "Mixtral 7x8B" scores 47.11 compared to "Llama 3 70B"'s 42.70.
### Interpretation
The bar chart strongly suggests that "Our Model" is significantly better at identifying and avoiding the listed logical fallacies compared to "Mixtral 7x8B" and "Llama 3 70B". The consistent high scores of "Our Model" indicate a robust ability to handle these types of reasoning errors. The other two models show varying degrees of success, with "Mixtral 7x8B" generally performing better than "Llama 3 70B", but still far from the performance of "Our Model". The data highlights the importance of model selection and training when dealing with tasks that require logical reasoning and the avoidance of common fallacies.