## Bar Chart: Fallacy Detection Performance Comparison
### Overview
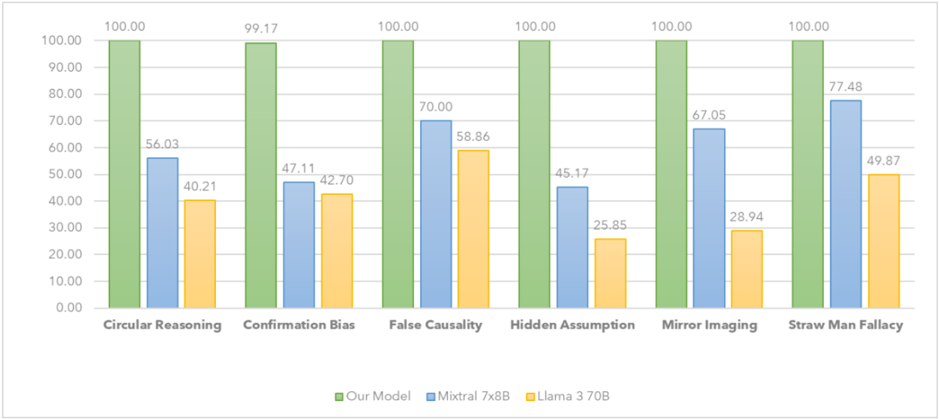
This bar chart compares the performance of three models – "Our Model" (green), "Mixtral 7x8B" (orange), and "Llama 3 70B" (blue) – in detecting six different types of logical fallacies: Circular Reasoning, Confirmation Bias, False Causality, Hidden Assumption, Mirror Imaging, and Straw Man Fallacy. The performance is measured as a percentage score, presumably representing accuracy or detection rate.
### Components/Axes
* **X-axis:** Represents the six types of logical fallacies: Circular Reasoning, Confirmation Bias, False Causality, Hidden Assumption, Mirror Imaging, and Straw Man Fallacy.
* **Y-axis:** Represents the performance score, ranging from 0.00 to 100.00. The axis is labeled with increments of 10.
* **Legend:** Located at the bottom-center of the chart, identifies the three models using color-coding:
* Green: "Our Model"
* Orange: "Mixtral 7x8B"
* Blue: "Llama 3 70B"
### Detailed Analysis
The chart consists of six groups of three bars, one for each model and fallacy type.
* **Circular Reasoning:**
* Our Model: 100.00
* Mixtral 7x8B: 56.03
* Llama 3 70B: 40.21
* **Confirmation Bias:**
* Our Model: 99.17
* Mixtral 7x8B: 47.11
* Llama 3 70B: 42.70
* **False Causality:**
* Our Model: 100.00
* Mixtral 7x8B: 70.00
* Llama 3 70B: 58.86
* **Hidden Assumption:**
* Our Model: 100.00
* Mixtral 7x8B: 25.85
* Llama 3 70B: 45.17
* **Mirror Imaging:**
* Our Model: 100.00
* Mixtral 7x8B: 67.05
* Llama 3 70B: 28.94
* **Straw Man Fallacy:**
* Our Model: 100.00
* Mixtral 7x8B: 77.48
* Llama 3 70B: 49.87
For each fallacy, "Our Model" consistently achieves a score of 100.00. Mixtral 7x8B and Llama 3 70B show varying performance across the different fallacy types, with generally lower scores than "Our Model".
### Key Observations
* "Our Model" demonstrates perfect performance (100%) across all six fallacy types.
* Mixtral 7x8B performs relatively better on "Straw Man Fallacy" (77.48%) and "False Causality" (70.00%) compared to other fallacies.
* Llama 3 70B consistently shows the lowest performance among the three models, particularly on "Mirror Imaging" (28.94%) and "Hidden Assumption" (45.17%).
* There is a significant performance gap between "Our Model" and the other two models across all fallacy types.
### Interpretation
The data strongly suggests that "Our Model" is significantly more effective at detecting these six types of logical fallacies than both Mixtral 7x8B and Llama 3 70B. The consistent 100% score indicates a high degree of accuracy and robustness. The varying performance of Mixtral 7x8B and Llama 3 70B across different fallacy types suggests that their ability to detect fallacies is more nuanced and dependent on the specific characteristics of each fallacy. The lower scores for Llama 3 70B may indicate limitations in its reasoning capabilities or training data related to logical fallacies.
The chart highlights the importance of specialized training or architecture in developing models capable of accurately identifying logical fallacies. The substantial difference in performance suggests that simply scaling up model size (as seen with Llama 3 70B) does not necessarily translate to improved fallacy detection capabilities. The data implies that "Our Model" has been specifically designed or trained to excel in this task, potentially through the use of targeted datasets or specialized algorithms.