\n
## Grouped Bar Chart: Model Performance on Logical Fallacy Detection
### Overview
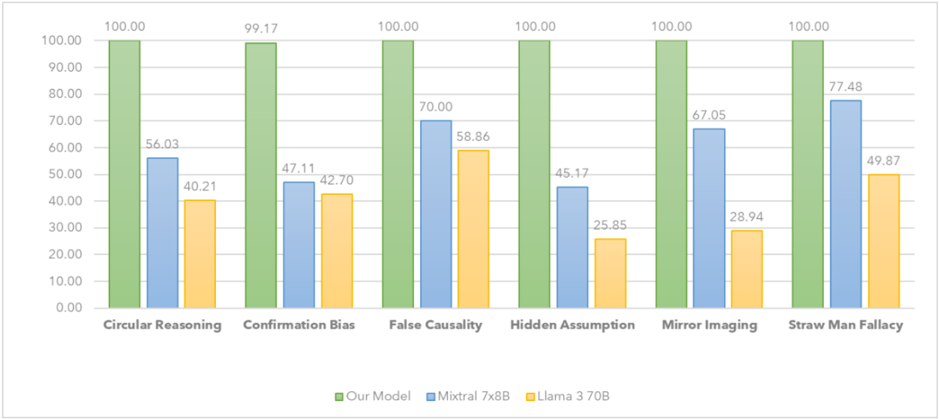
The image displays a grouped bar chart comparing the performance (in percentage) of three different AI models across six categories of logical fallacies. The chart is designed to evaluate and contrast the models' capabilities in identifying specific reasoning errors.
### Components/Axes
* **Chart Type:** Grouped vertical bar chart.
* **X-Axis (Categories):** Lists six types of logical fallacies. From left to right:
1. Circular Reasoning
2. Confirmation Bias
3. False Causality
4. Hidden Assumption
5. Mirror Imaging
6. Straw Man Fallacy
* **Y-Axis (Scale):** Represents a performance score, likely accuracy or detection rate, as a percentage. The scale runs from 0.00 to 100.00, with major gridlines at intervals of 10.00.
* **Legend:** Located at the bottom center of the chart. It defines the three data series by color:
* **Green Bar:** "Our Model"
* **Blue Bar:** "Mixtral 7x8B"
* **Yellow Bar:** "Llama 3 70B"
* **Data Labels:** Each bar has its exact numerical value displayed at its top.
### Detailed Analysis
Performance values for each model across the six fallacy categories:
| Logical Fallacy Category | Our Model (Green) | Mixtral 7x8B (Blue) | Llama 3 70B (Yellow) |
| :--- | :--- | :--- | :--- |
| **Circular Reasoning** | 100.00 | 56.03 | 40.21 |
| **Confirmation Bias** | 99.17 | 47.11 | 42.70 |
| **False Causality** | 100.00 | 70.00 | 58.86 |
| **Hidden Assumption** | 100.00 | 45.17 | 25.85 |
| **Mirror Imaging** | 100.00 | 67.05 | 28.94 |
| **Straw Man Fallacy** | 100.00 | 77.48 | 49.87 |
**Trend Verification per Data Series:**
* **Our Model (Green):** The line of green bar tops is essentially flat at the 100% ceiling, with a single minor dip to 99.17 for Confirmation Bias. This indicates near-perfect and consistent performance across all tested fallacy types.
* **Mixtral 7x8B (Blue):** The blue bars show significant variation. The trend line is irregular, with a low point at Hidden Assumption (45.17) and a peak at Straw Man Fallacy (77.48). Performance is generally in the mid-range.
* **Llama 3 70B (Yellow):** The yellow bars are consistently the shortest in each group, indicating the lowest performance among the three. The trend is also variable, with a notable low at Hidden Assumption (25.85) and a relative high at False Causality (58.86).
### Key Observations
1. **Dominant Performance:** "Our Model" achieves a perfect or near-perfect score (99.17-100.00) in every category, establishing a clear performance ceiling.
2. **Significant Performance Gaps:** There is a substantial gap between "Our Model" and the other two models in all categories. The gap is most extreme in "Hidden Assumption" (a 54.83-point lead over Mixtral and a 74.15-point lead over Llama).
3. **Model-Specific Weaknesses:** Both comparison models show their weakest performance on "Hidden Assumption." "Llama 3 70B" also performs particularly poorly on "Mirror Imaging" (28.94).
4. **Relative Strength of Comparison Models:** Among the two comparison models, "Mixtral 7x8B" consistently outperforms "Llama 3 70B" in every category. The closest they come is in "Confirmation Bias" (a 4.41-point difference).
5. **Category Difficulty:** "Hidden Assumption" appears to be the most challenging fallacy for the non-dominant models, while "Straw Man Fallacy" and "False Causality" yield their relatively higher scores.
### Interpretation
This chart presents a compelling performance benchmark in the domain of logical reasoning for AI models. The data strongly suggests that "Our Model" has been specifically trained or architected to excel at identifying a wide spectrum of logical fallacies, achieving what appears to be mastery in this test.
The consistent, large performance delta indicates a fundamental difference in capability, not just incremental improvement. The fact that both "Mixtral 7x8B" and "Llama 3 70B" struggle most with "Hidden Assumption" and "Mirror Imaging" suggests these fallacy types may require more nuanced contextual understanding or world knowledge to detect, which "Our Model" possesses to a greater degree.
From a technical document perspective, this chart serves as evidence of a significant advancement in a specific AI capability—logical fallacy detection. It positions "Our Model" as a specialized tool for tasks requiring rigorous reasoning analysis, such as evaluating argument quality, fact-checking, or enhancing the reliability of AI-generated content. The clear visualization of the performance gap makes the case for the model's superiority in this domain more effectively than raw numbers alone.