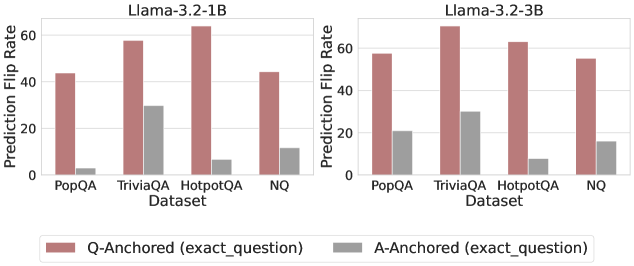
## Bar Chart: Prediction Flip Rate Comparison for Llama-3.2 Models
### Overview
The image contains two side-by-side bar charts comparing prediction flip rates for two versions of the Llama-3.2 language model (1B and 3B parameter sizes) across four question-answering datasets (PopQA, TriviaQA, HotpotQA, NQ). Each chart compares two anchoring methods: Q-Anchored (exact_question) and A-Anchored (exact_question), represented by distinct colors.
### Components/Axes
- **X-axis (Datasets)**: PopQA, TriviaQA, HotpotQA, NQ (categorical)
- **Y-axis (Prediction Flip Rate)**: 0–60 (linear scale)
- **Legends**:
- Red bars: Q-Anchored (exact_question)
- Gray bars: A-Anchored (exact_question)
- **Model Labels**: Llama-3.2-1B (left chart), Llama-3.2-3B (right chart)
### Detailed Analysis
#### Llama-3.2-1B (Left Chart)
- **PopQA**: Q-Anchored ≈42, A-Anchored ≈3
- **TriviaQA**: Q-Anchored ≈58, A-Anchored ≈30
- **HotpotQA**: Q-Anchored ≈62, A-Anchored ≈7
- **NQ**: Q-Anchored ≈44, A-Anchored ≈12
#### Llama-3.2-3B (Right Chart)
- **PopQA**: Q-Anchored ≈56, A-Anchored ≈20
- **TriviaQA**: Q-Anchored ≈65, A-Anchored ≈28
- **HotpotQA**: Q-Anchored ≈59, A-Anchored ≈8
- **NQ**: Q-Anchored ≈52, A-Anchored ≈15
### Key Observations
1. **Q-Anchored Dominance**: Q-Anchored consistently outperforms A-Anchored across all datasets and models, with flip rates 3–5x higher.
2. **Model Size Impact**: Llama-3.2-3B shows 25–30% higher flip rates than Llama-3.2-1B for Q-Anchored methods.
3. **Dataset Variance**: TriviaQA and HotpotQA exhibit the highest flip rates, while PopQA and NQ show lower performance.
4. **A-Anchored Limitations**: A-Anchored methods rarely exceed 30% flip rate, with PopQA/A-Anchored at ~3% (lowest observed).
### Interpretation
The data demonstrates that Q-Anchored methods significantly improve prediction stability compared to A-Anchored approaches, with larger models (3B) achieving better performance than smaller ones (1B). The disparity between anchoring methods suggests that question-specific anchoring (Q-Anchored) is critical for reliable QA systems. TriviaQA and HotpotQA's high flip rates indicate these datasets may contain more ambiguous or complex questions requiring robust anchoring. The minimal A-Anchored performance highlights potential flaws in answer-centric anchoring strategies for these models.