## Bar Chart: Prediction Flip Rate for Llama Models
### Overview
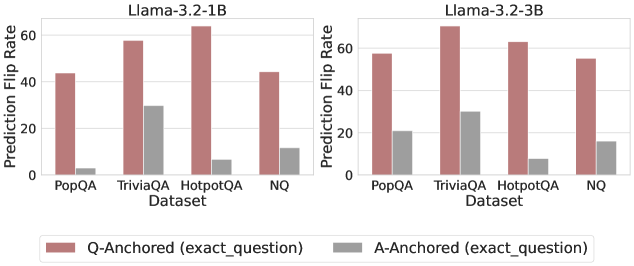
The image presents a comparative bar chart illustrating the prediction flip rate for two Llama models (Llama-3.2-1B and Llama-3.2-3B) across four different datasets: PopQA, TriviaQA, HotpotQA, and NQ. The flip rate is measured as the percentage of predictions that change when the input is altered between question-anchored and answer-anchored prompts.
### Components/Axes
* **X-axis:** Dataset (PopQA, TriviaQA, HotpotQA, NQ)
* **Y-axis:** Prediction Flip Rate (ranging from 0 to 60)
* **Models:** Two separate charts, one for Llama-3.2-1B and one for Llama-3.2-3B. Each chart displays the same datasets.
* **Legend:**
* Red: Q-Anchored (exact\_question)
* Gray: A-Anchored (exact\_question)
* **Chart Arrangement:** Two charts are positioned side-by-side.
### Detailed Analysis
**Llama-3.2-1B Chart:**
* **PopQA:** Q-Anchored: Approximately 48. A-Anchored: Approximately 32.
* **TriviaQA:** Q-Anchored: Approximately 56. A-Anchored: Approximately 28.
* **HotpotQA:** Q-Anchored: Approximately 60. A-Anchored: Approximately 8.
* **NQ:** Q-Anchored: Approximately 48. A-Anchored: Approximately 16.
The Q-Anchored bars consistently show higher flip rates than the A-Anchored bars across all datasets. The highest flip rate for this model is observed on the HotpotQA dataset with Q-Anchored prompts.
**Llama-3.2-3B Chart:**
* **PopQA:** Q-Anchored: Approximately 52. A-Anchored: Approximately 24.
* **TriviaQA:** Q-Anchored: Approximately 58. A-Anchored: Approximately 24.
* **HotpotQA:** Q-Anchored: Approximately 52. A-Anchored: Approximately 8.
* **NQ:** Q-Anchored: Approximately 48. A-Anchored: Approximately 16.
Similar to the 1B model, the 3B model also exhibits higher flip rates for Q-Anchored prompts. The highest flip rate for this model is observed on the TriviaQA dataset with Q-Anchored prompts.
### Key Observations
* **Q-Anchored vs. A-Anchored:** The prediction flip rate is significantly higher when the prompt is anchored to the question (Q-Anchored) compared to being anchored to the answer (A-Anchored) for both models and all datasets.
* **Dataset Variation:** The flip rate varies depending on the dataset. HotpotQA consistently shows the highest flip rate for the 1B model, while TriviaQA shows the highest flip rate for the 3B model.
* **Model Comparison:** The 3B model generally shows slightly higher flip rates than the 1B model, particularly for PopQA and TriviaQA.
### Interpretation
The data suggests that both Llama models are sensitive to the way the prompt is framed – specifically, whether it emphasizes the question or the answer. The higher flip rate for Q-Anchored prompts indicates that the models are more likely to change their predictions when the focus is shifted to the question itself. This could be due to the models relying on subtle cues in the question to generate their answers, and these cues are more prominent when the question is explicitly emphasized.
The variation in flip rates across datasets suggests that the models' sensitivity to prompt framing is influenced by the characteristics of the dataset. Datasets like HotpotQA and TriviaQA, which may require more complex reasoning or knowledge retrieval, might be more susceptible to changes in prompt framing.
The slightly higher flip rates observed for the 3B model could indicate that larger models are more sensitive to subtle changes in input, potentially due to their increased capacity to capture and process complex relationships in the data. This sensitivity could be a double-edged sword, as it might lead to more accurate predictions in some cases but also make the models more vulnerable to adversarial attacks or prompt engineering.