## Bar Chart: Performance Comparison Across Models and Frequency Bands
### Overview
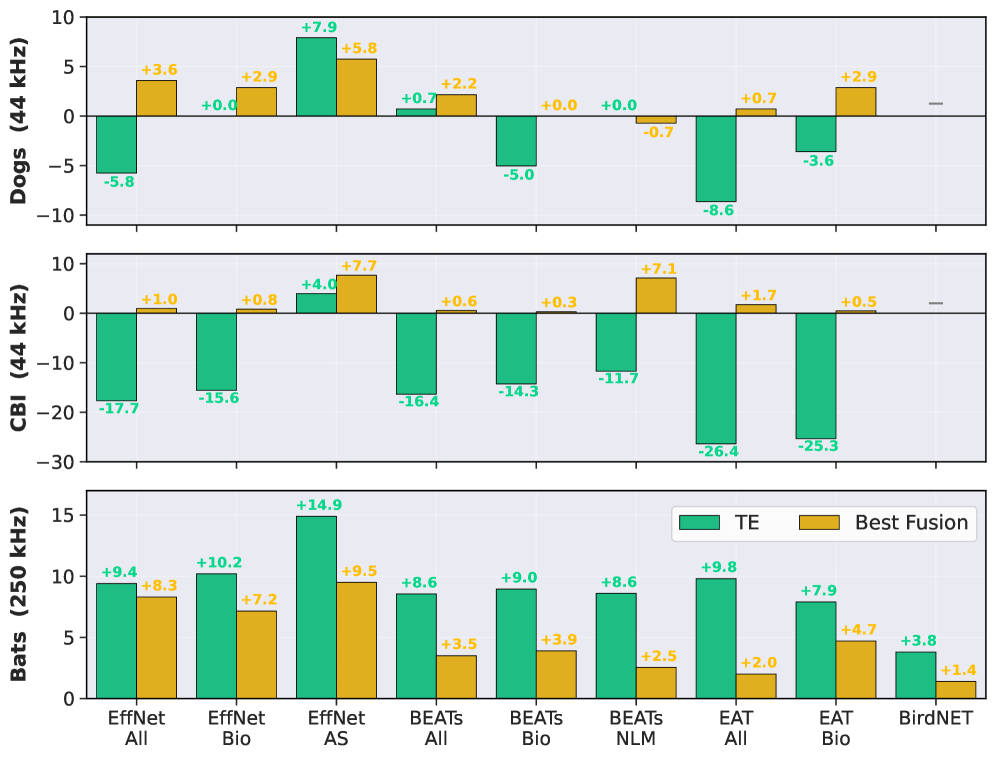
The image presents a comparative bar chart analyzing performance metrics across three frequency bands (Dogs at 44 kHz, CBI at 44 kHz, and Bats at 250 kHz) for various audio processing models. Two data series are compared: "TE" (green bars) and "Best Fusion" (yellow bars), with numerical values indicating performance differences from a baseline.
### Components/Axes
- **X-Axis**: Model categories:
- EffNet All
- EffNet Bio
- EffNet AS
- BEATs All
- BEATs Bio
- BEATs NLM
- EAT All
- EAT Bio
- BirdNET
- **Y-Axes**:
- **Dogs (44 kHz)**: Range -10 to +10 (44 kHz)
- **CBI (44 kHz)**: Range -30 to +10 (44 kHz)
- **Bats (250 kHz)**: Range 0 to +15 (250 kHz)
- **Legend**:
- Green = TE
- Yellow = Best Fusion
- **Positioning**: Legend located in the bottom-right corner. Bars are clustered by model category across the three y-axes.
### Detailed Analysis
#### Dogs (44 kHz)
- **EffNet All**: TE = -5.8, Best Fusion = +3.6
- **EffNet Bio**: TE = +0.0, Best Fusion = +2.9
- **EffNet AS**: TE = +7.9, Best Fusion = +5.8
- **BEATs All**: TE = +0.7, Best Fusion = +2.2
- **BEATs Bio**: TE = -5.0, Best Fusion = +0.0
- **BEATs NLM**: TE = -0.7, Best Fusion = +0.0
- **EAT All**: TE = -8.6, Best Fusion = +0.7
- **EAT Bio**: TE = -3.6, Best Fusion = +2.9
- **BirdNET**: TE = 0.0, Best Fusion = N/A
#### CBI (44 kHz)
- **EffNet All**: TE = -17.7, Best Fusion = +1.0
- **EffNet Bio**: TE = -15.6, Best Fusion = +0.8
- **EffNet AS**: TE = +4.0, Best Fusion = +7.7
- **BEATs All**: TE = -16.4, Best Fusion = +0.6
- **BEATs Bio**: TE = -14.3, Best Fusion = +0.3
- **BEATs NLM**: TE = -11.7, Best Fusion = +7.1
- **EAT All**: TE = -26.4, Best Fusion = +1.7
- **EAT Bio**: TE = -25.3, Best Fusion = +0.5
- **BirdNET**: TE = 0.0, Best Fusion = N/A
#### Bats (250 kHz)
- **EffNet All**: TE = +9.4, Best Fusion = +8.3
- **EffNet Bio**: TE = +10.2, Best Fusion = +7.2
- **EffNet AS**: TE = +14.9, Best Fusion = +9.5
- **BEATs All**: TE = +8.6, Best Fusion = +3.5
- **BEATs Bio**: TE = +9.0, Best Fusion = +3.9
- **BEATs NLM**: TE = +8.6, Best Fusion = +2.5
- **EAT All**: TE = +9.8, Best Fusion = +2.0
- **EAT Bio**: TE = +7.9, Best Fusion = +4.7
- **BirdNET**: TE = +3.8, Best Fusion = +1.4
### Key Observations
1. **Best Fusion Outperforms TE**: In all categories except BirdNET (no Best Fusion data), yellow bars (Best Fusion) show higher values than green bars (TE).
2. **CBI Band Extremes**:
- Most negative TE values occur in EAT All (-26.4) and EAT Bio (-25.3).
- Best Fusion shows minimal improvement in CBI (max +7.7 in EffNet AS).
3. **Bats Band Dominance**:
- EffNet AS achieves the highest TE value (+14.9) and Best Fusion (+9.5).
- BirdNET underperforms compared to other models in this band.
4. **Mixed Performance in Dogs**:
- EffNet AS shows strong TE performance (+7.9), but Best Fusion lags (+5.8).
- EAT All has the worst TE performance (-8.6) but slight Best Fusion improvement (+0.7).
### Interpretation
The data suggests that **Best Fusion** consistently improves performance across models and frequency bands compared to TE, with the most significant gains observed in the **Bats (250 kHz)** band. However, **CBI (44 kHz)** reveals critical weaknesses in TE performance, particularly for EAT models, where Best Fusion only partially mitigates losses. The **EffNet AS** model emerges as the strongest performer in Bats, while **EAT All** exhibits the most severe TE underperformance in CBI. BirdNET's absence in the Best Fusion comparison for CBI and Dogs raises questions about its applicability or data availability. The stark contrast between TE and Best Fusion in CBI highlights potential architectural or fusion strategy advantages in the latter approach.