\n
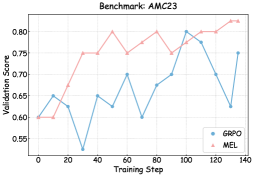
## Line Chart: Validation Score vs. Training Step (Benchmark: AMC23)
### Overview
This image presents a line chart comparing the validation scores of two models, GRPO and MEL, across 140 training steps on the AMC23 benchmark. The chart visualizes the performance of each model as training progresses, allowing for a comparison of their learning curves.
### Components/Axes
* **Title:** Benchmark: AMC23 (positioned at the top-center)
* **X-axis:** Training Step (ranging from 0 to 140, with tick marks at intervals of 20)
* **Y-axis:** Validation Score (ranging from 0.60 to 0.82, with tick marks at intervals of 0.05)
* **Legend:** Located in the top-right corner.
* GRPO (represented by a light blue line with circular markers)
* MEL (represented by a light red line with triangular markers)
### Detailed Analysis
**GRPO (Light Blue Line):**
The GRPO line exhibits a fluctuating trend. It starts at approximately 0.63, dips to a low of around 0.58 at step 40, then rises to approximately 0.68 at step 80. It then increases to a peak of around 0.79 at step 100, followed by a decline to approximately 0.63 at step 120, and finally recovers slightly to around 0.70 at step 140.
* Step 0: ~0.63
* Step 20: ~0.65
* Step 40: ~0.58
* Step 60: ~0.67
* Step 80: ~0.68
* Step 100: ~0.79
* Step 120: ~0.63
* Step 140: ~0.70
**MEL (Light Red Line):**
The MEL line shows a generally increasing trend with some fluctuations. It begins at approximately 0.61, rises steadily to a peak of around 0.81 at step 60, then dips to approximately 0.76 at step 80. It then increases again to around 0.80 at step 100, dips to approximately 0.78 at step 120, and finally rises to around 0.81 at step 140.
* Step 0: ~0.61
* Step 20: ~0.64
* Step 40: ~0.74
* Step 60: ~0.81
* Step 80: ~0.76
* Step 100: ~0.80
* Step 120: ~0.78
* Step 140: ~0.81
### Key Observations
* MEL consistently outperforms GRPO across all training steps.
* Both models exhibit fluctuations in validation score, indicating potential instability during training.
* GRPO shows a more pronounced dip in performance around step 40.
* Both models appear to converge towards a stable validation score towards the end of the training process (steps 120-140).
### Interpretation
The chart demonstrates that the MEL model achieves higher validation scores than the GRPO model on the AMC23 benchmark. This suggests that MEL is a more effective model for this particular task. The fluctuations in validation scores for both models could be attributed to factors such as the stochastic nature of the training process, the learning rate, or the complexity of the dataset. The convergence towards stable scores at the end of training indicates that both models are learning and improving, but MEL consistently maintains a higher level of performance. The initial dip in GRPO's performance might indicate a slower initial learning rate or a greater sensitivity to initial conditions. The overall trend suggests that continued training might lead to further improvements in both models, but MEL is likely to remain the superior performer.