\n
## Diagram: Context-based Layer Set Optimization and Confidence-aware Inference Acceleration
### Overview
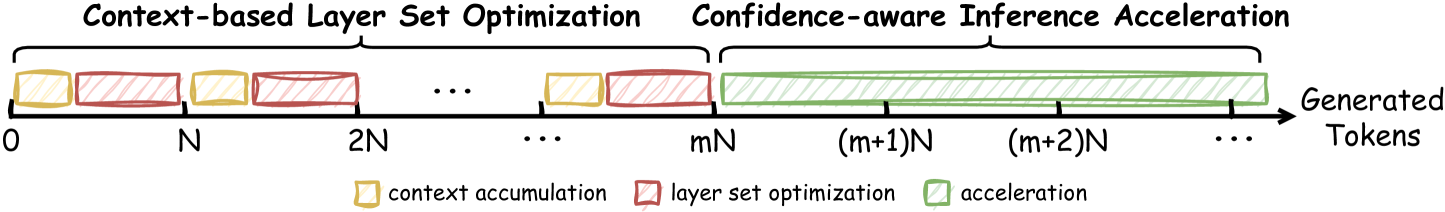
The image is a diagram illustrating a process divided into two main phases: "Context-based Layer Set Optimization" and "Confidence-aware Inference Acceleration". The diagram depicts these phases occurring sequentially along a timeline representing "Generated Tokens". The timeline is marked with numerical values representing multiples of 'N', and the diagram uses colored blocks to represent different stages within the process.
### Components/Axes
* **X-axis:** Represents "Generated Tokens", with markers at 0, N, 2N, mN, (m+1)N, (m+2)N, and continuing with "...".
* **Phases:** Two main phases are labeled:
* "Context-based Layer Set Optimization" (spanning from 0 to mN)
* "Confidence-aware Inference Acceleration" (spanning from mN onwards)
* **Legend:** Located at the bottom-right, the legend defines the color-coding:
* Yellow: "context accumulation"
* Red: "layer set optimization"
* Green: "acceleration"
### Detailed Analysis
The diagram shows a repeating pattern within the "Context-based Layer Set Optimization" phase. This pattern consists of a yellow block ("context accumulation") followed by a red block ("layer set optimization"). This pattern repeats multiple times, indicated by the "...".
The "Confidence-aware Inference Acceleration" phase is represented by a long series of green blocks ("acceleration"). The green blocks become increasingly dense towards the right, suggesting an increasing rate of acceleration.
The x-axis is divided into segments marked by multiples of N. The transition from the optimization phase to the acceleration phase occurs at mN. The diagram does not provide a specific value for 'm'.
### Key Observations
* The process begins with context accumulation and layer set optimization, which are repeated multiple times.
* After a certain point (mN), the process transitions to a phase of acceleration.
* The acceleration phase appears to be continuous and increasing in intensity.
* The diagram does not provide quantitative data about the duration or intensity of each phase.
### Interpretation
The diagram illustrates a two-stage process for generating tokens. The initial "Context-based Layer Set Optimization" phase focuses on building context and refining the model's parameters. This phase involves iterative accumulation of context and optimization of layer sets. Once sufficient context is established (at mN), the process transitions to the "Confidence-aware Inference Acceleration" phase, where the model leverages its learned knowledge to generate tokens more efficiently. The increasing density of green blocks suggests that the acceleration becomes more pronounced as the process continues, potentially due to increased confidence in the model's predictions.
The diagram suggests a strategy for balancing exploration (optimization) and exploitation (acceleration) in a token generation process. The initial optimization phase ensures that the model has a strong foundation of knowledge, while the subsequent acceleration phase allows it to generate tokens quickly and efficiently. The value of 'm' likely represents a threshold or trigger point for switching between these two phases, and its optimal value would depend on the specific application and model architecture.